When creating a numerical attribute on an asset type, you can designate certain attributes as “statistics” for another attribute. This will allow them to display differently on the asset history plot. We currently offer minimum, maximum, and standard deviation as the possible statistical associations.
Configuring your stats:
-
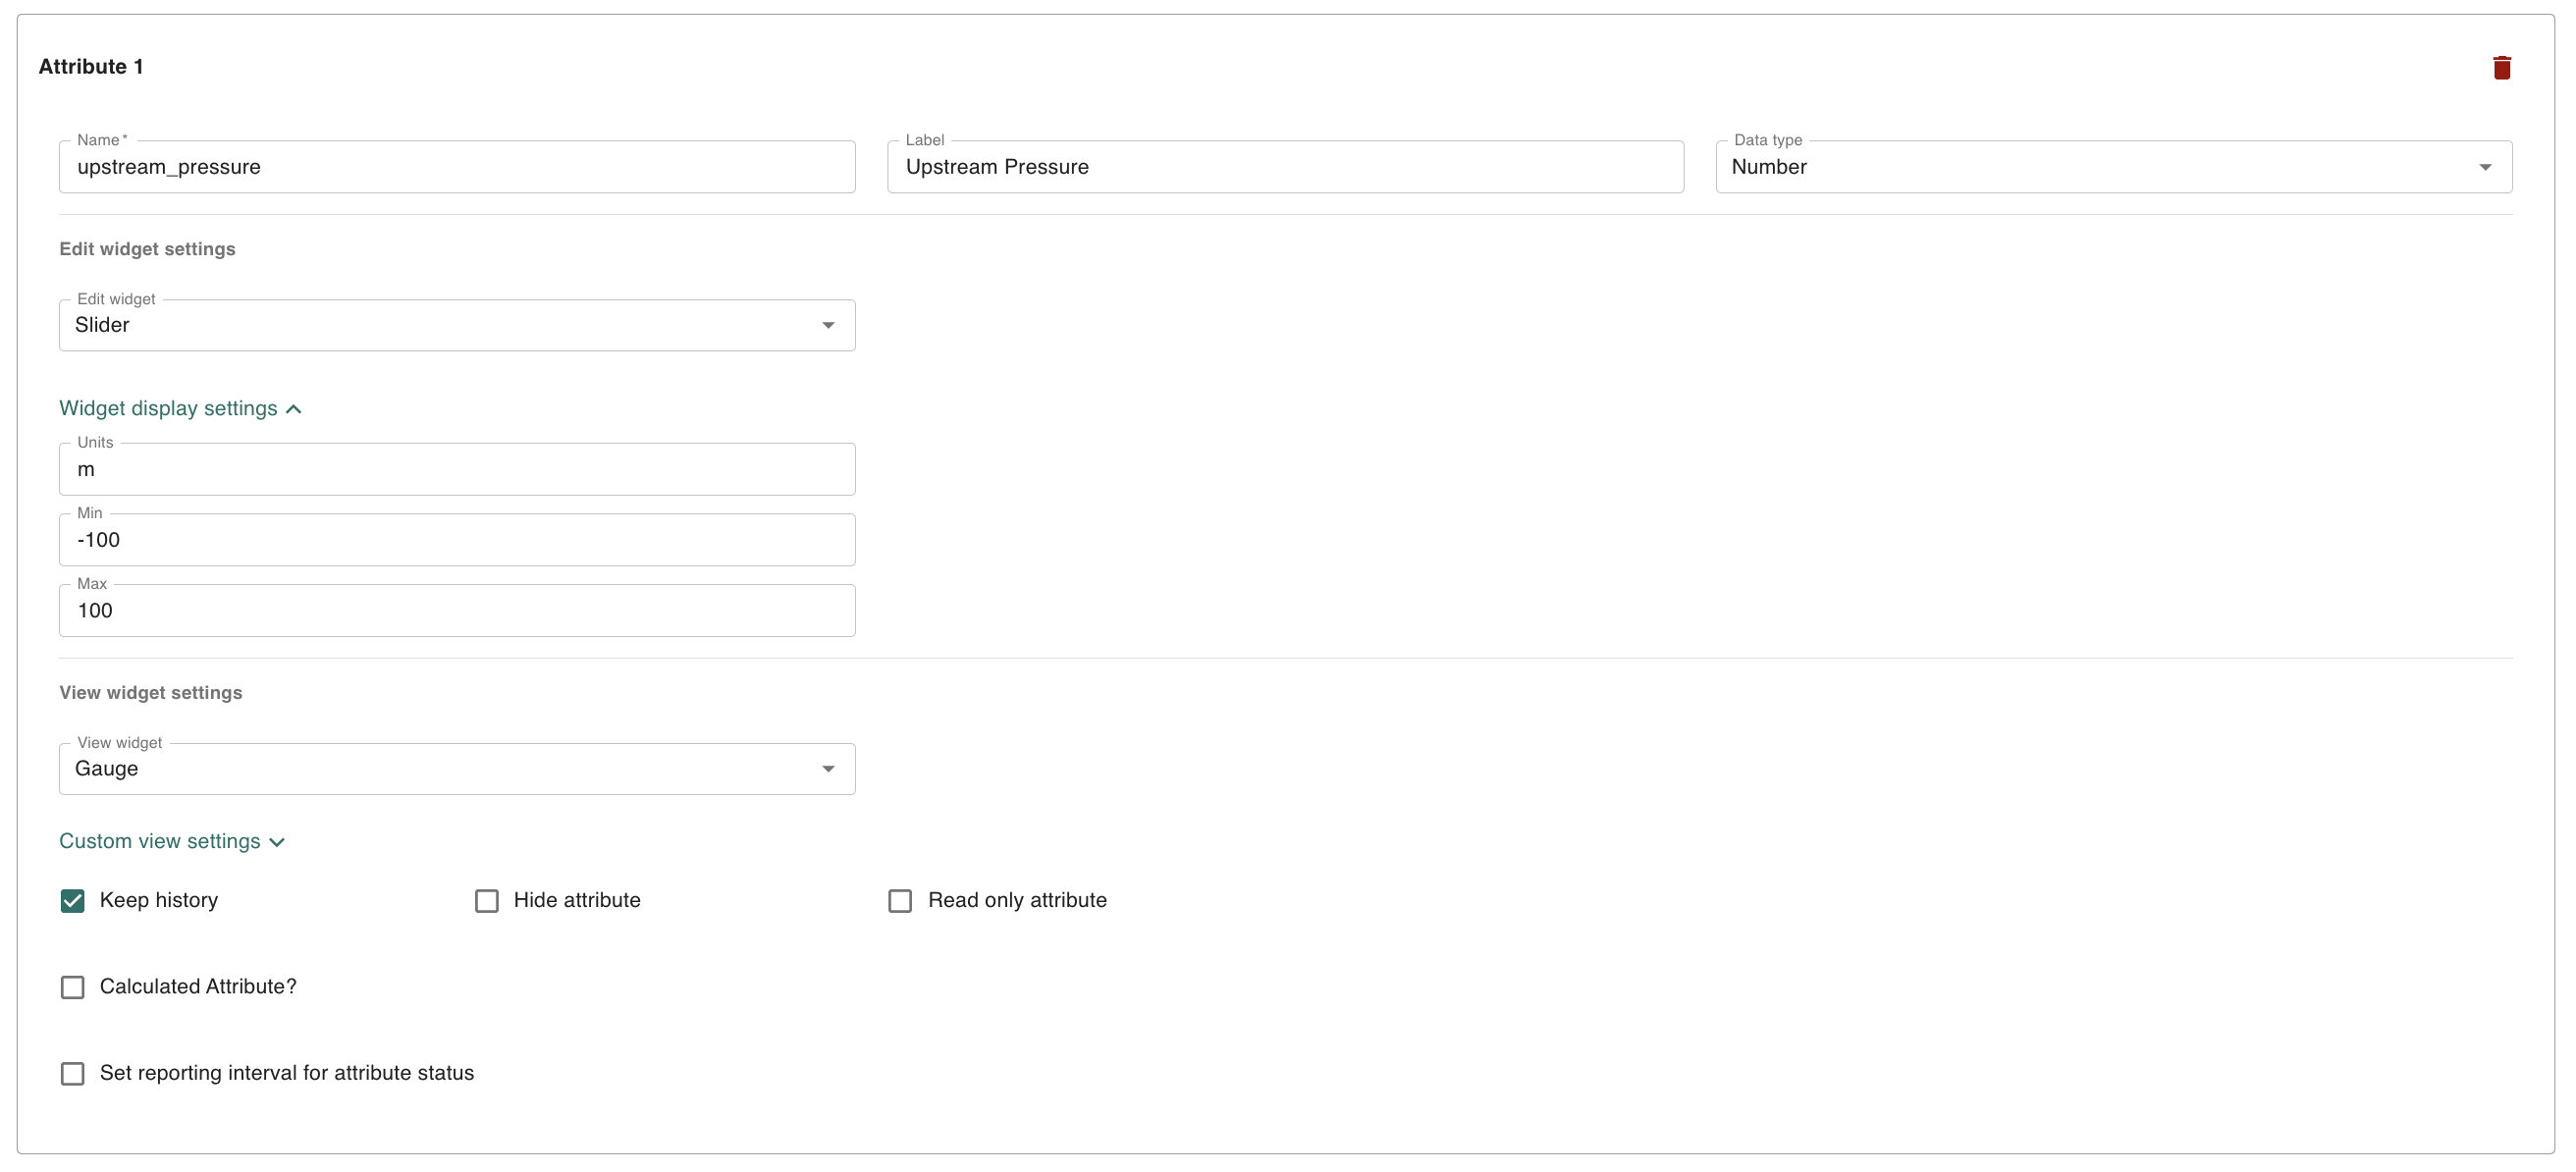
First define your main numerical attribute
-
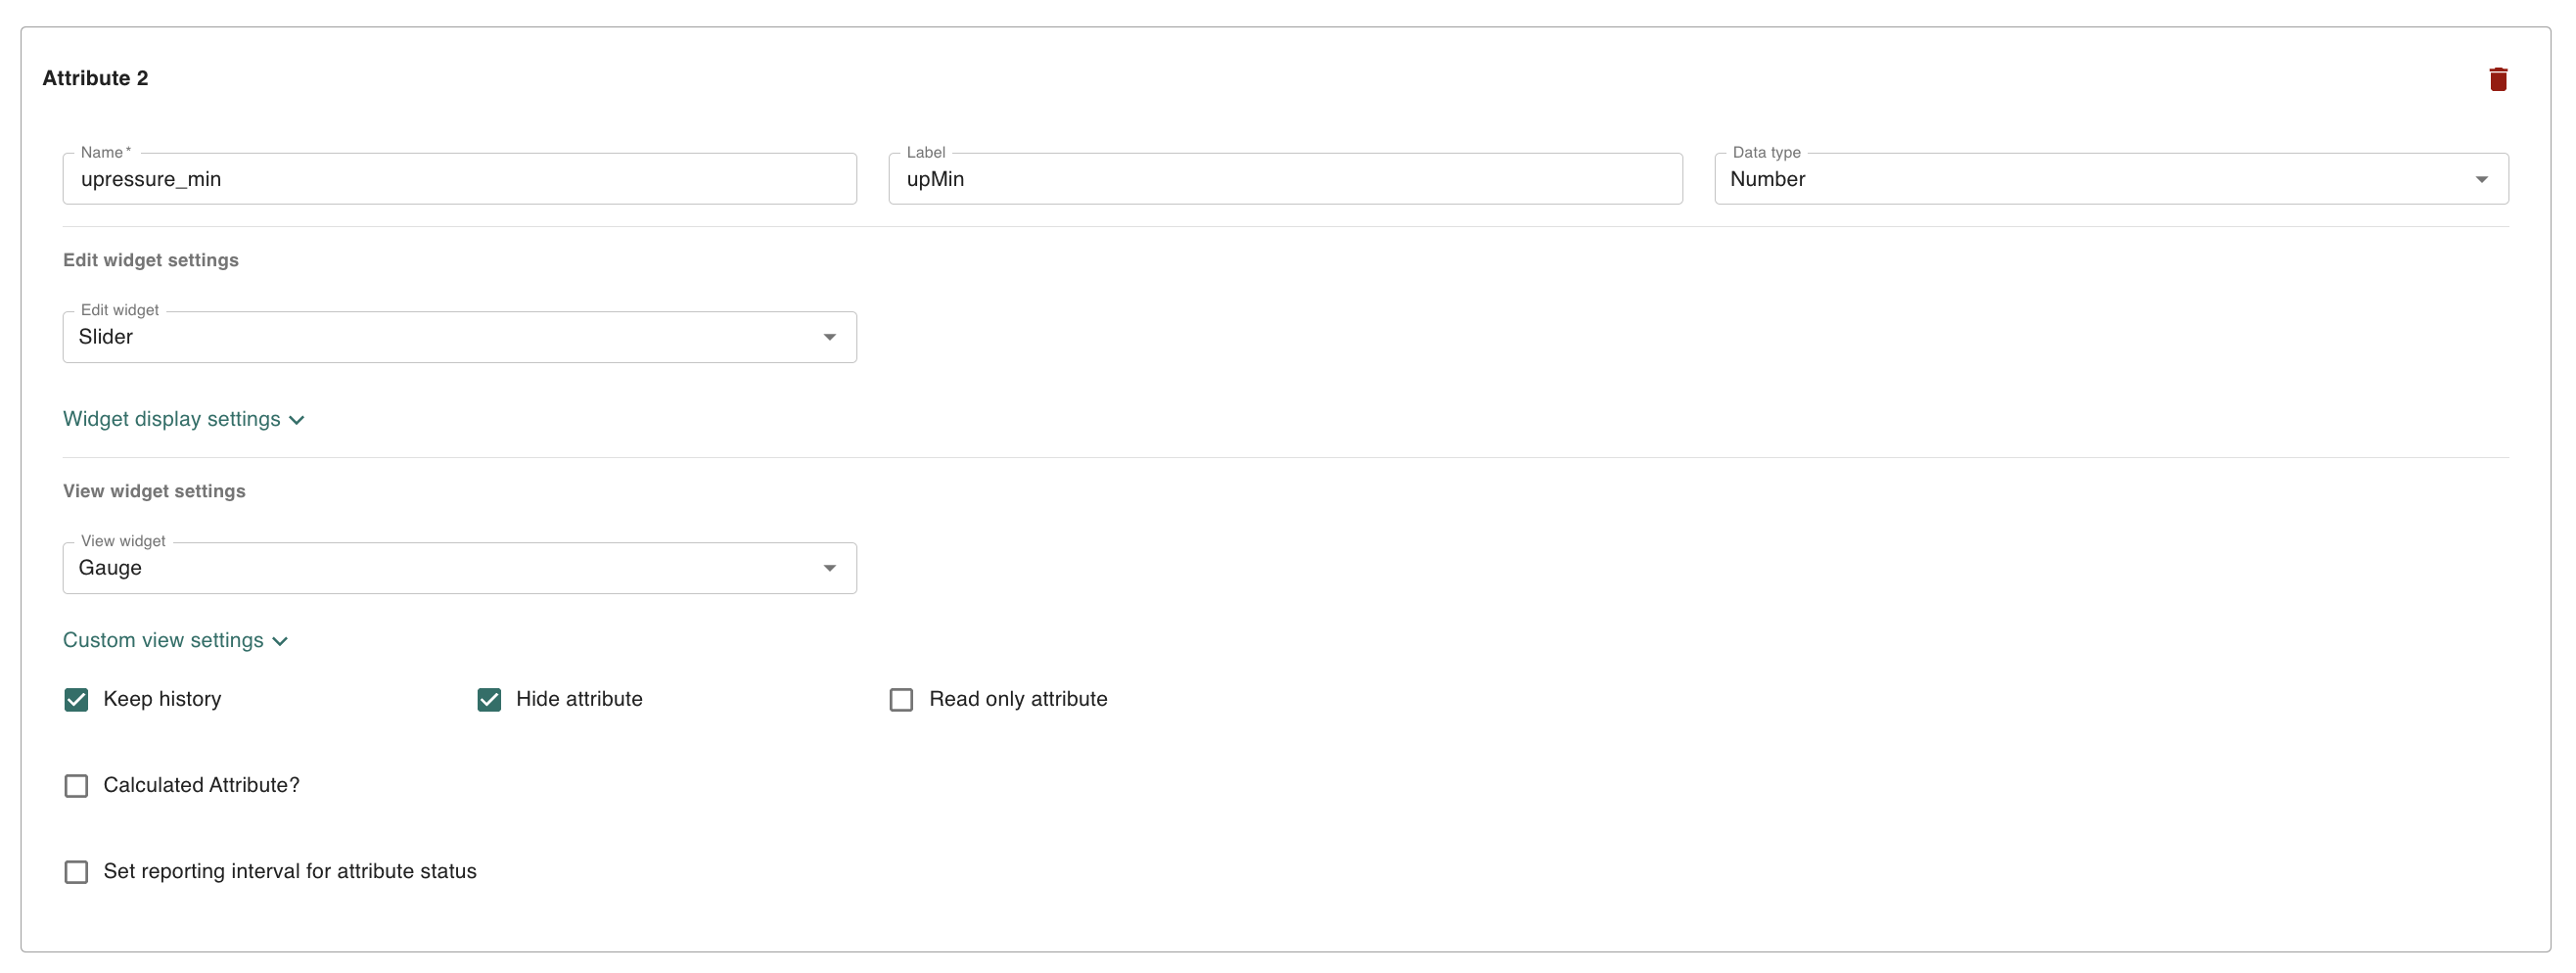
Then define the attributes you plan to use as statistics, such as the min, max, and standard deviations.
-
Tip: you can utilize the “Calculated Attribute?” setting to dynamically calculate these attributes based on the main attribute’s value.
-
Tip: you can mark these attributes as “Hide attribute” so that you don’t have to view them throughout the app, but they will still be viewable on the asset history plot.
-
-
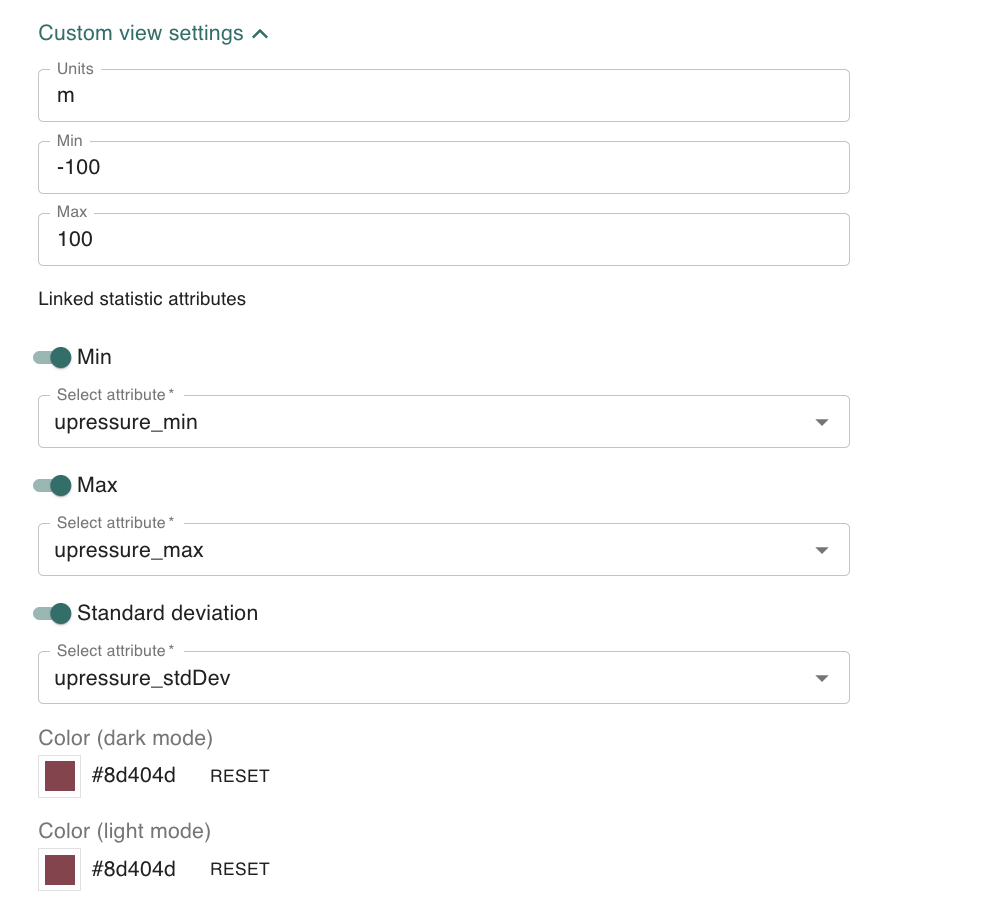
Return to the settings for the main attribute, expand the Custom View Settings, and link the statistical attributes with your main attribute.
-
Note that any colors you assign to the main or statistical attributes will be used when displaying these values on the asset history plot.
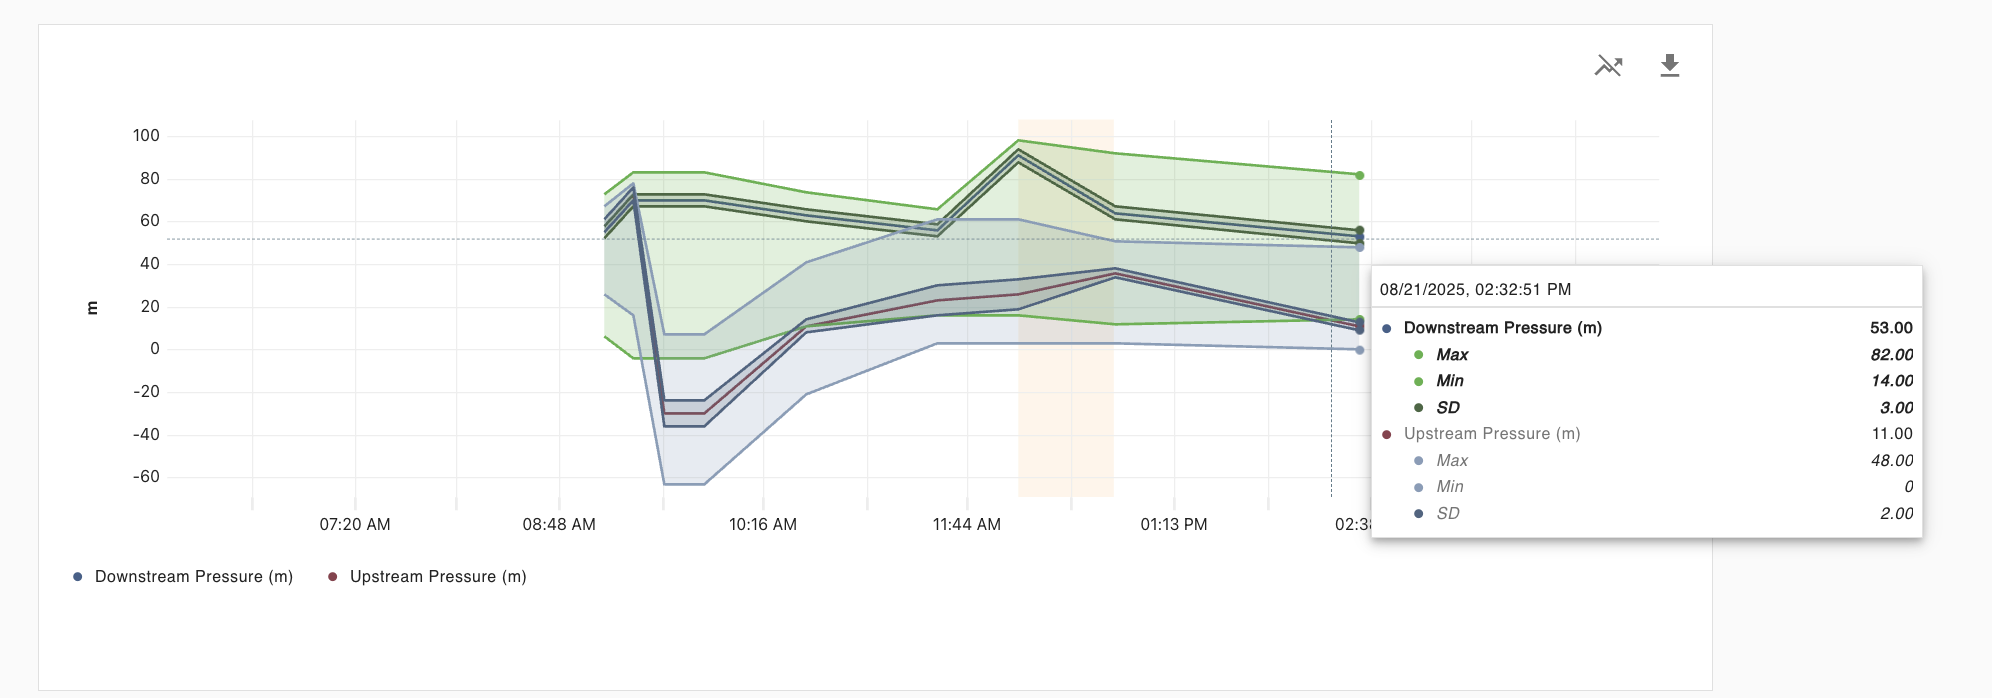
Viewing your stats:
Go to the history tab on the asset detail page, and view the plots. When the “Show statistics” option is turned off, the statistical attributes will not be visible on the asset history plot.
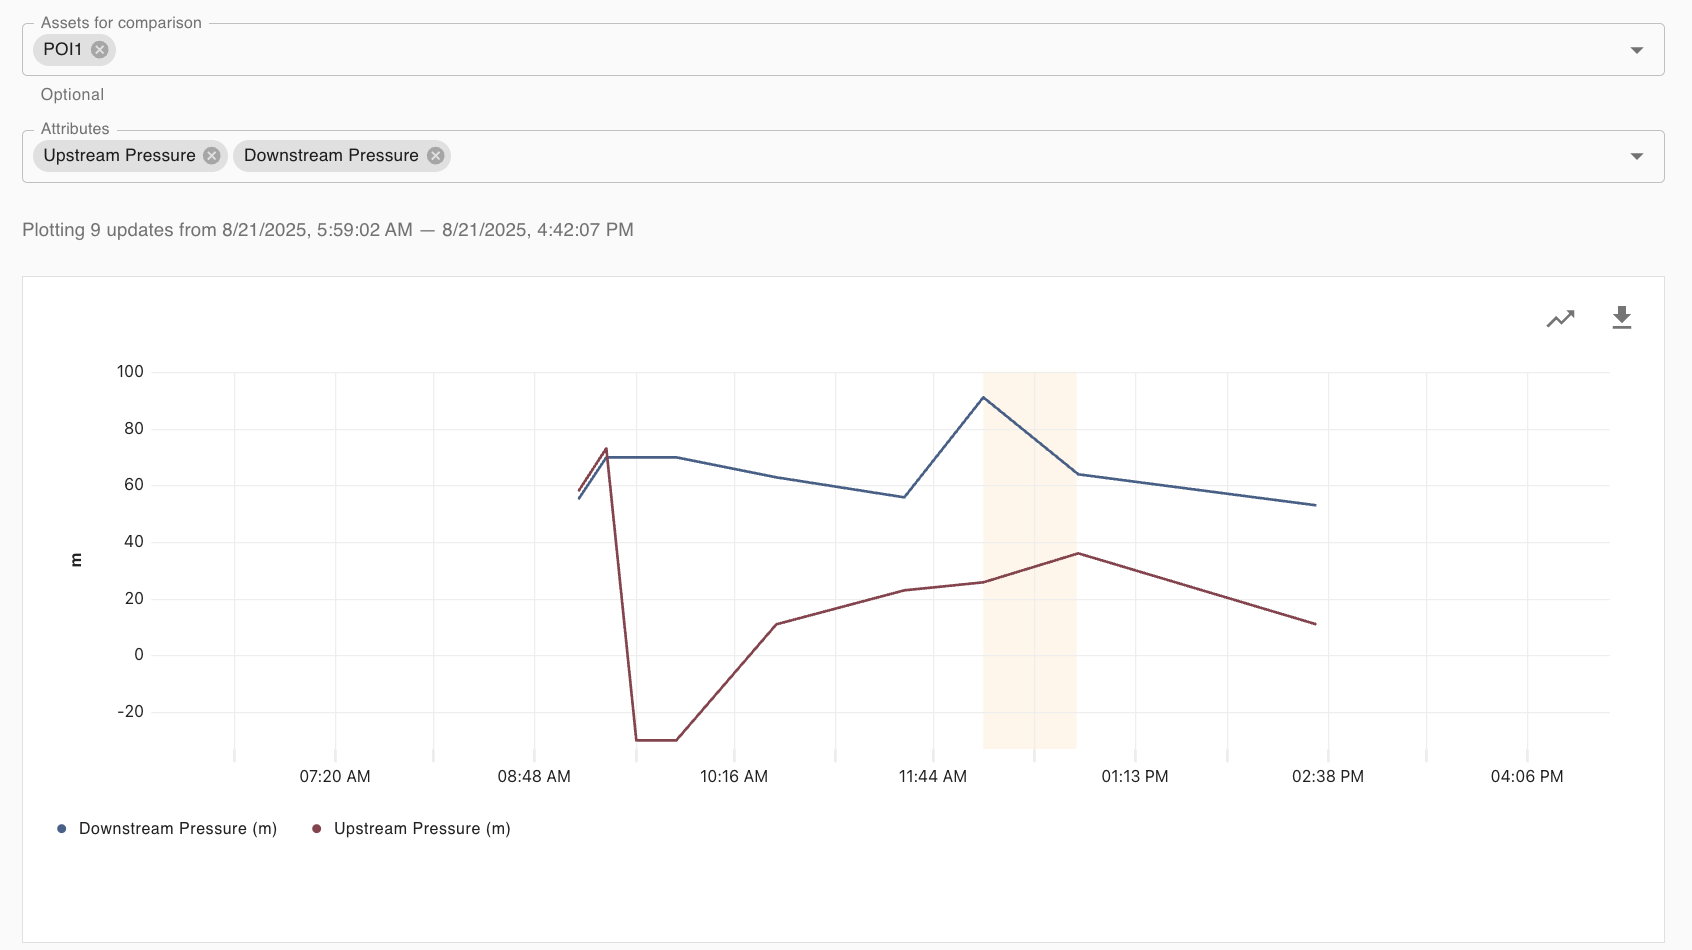
When “Show statistics” has been turn on, the statistics will display on the graph with shaded regions, and be listed under their associated attribute on the tooltip.