
An Asset is a device, a piece of equipment, or a gateway that is of value to an organization. Intelligent Assets allows for the monitoring, configuration and control of such assets.
An Asset is defined by a single Asset Type which contains the attributes relevant to the asset.
Create asset
-
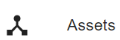
Click Assets on the left menu:
-
Click the + button on the top right of the screen:
-
Select the Type of the new Asset. Then click CREATE:
-
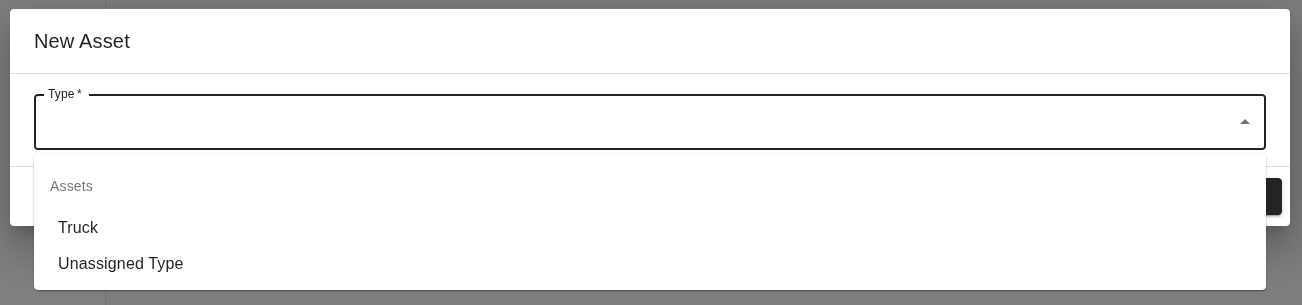
Fill out the information. Then click CREATE:
Required values
|
Value |
Definition |
|
Type |
Asset Type should already be assigned per previous modal. Here you can change the Asset Type, if needed, to a previously created one. |
|
ID |
The asset’s unique ID. An ID is provided, but can be edited in this modal. Once the asset is created, the ID can no longer be edited. Click the |
|
Label |
The Asset’s Label |
|
Groups |
The Asset’s Groups. A user must belong to at least one of these groups to access the asset. |
Optional values
|
Value |
Definition |
|
Children |
Secondary assets that have been created previously |
|
Owners |
The user(s) email managing the asset |
|
Image |
The asset’s image to be kept on record |
|
Last updated |
Timestamp of the asset’s most recent update |
|
Location updated |
Timestamp of the asset’s location update |
|
Latitude |
The latitude of the asset’s map location |
|
Longitude |
The longitude of the asset’s map location |
|
Description |
The asset’s description |
Attributes
The Attributes section allows setting of values of the asset’s non-read-only attribute.
Here is an asset creation video.
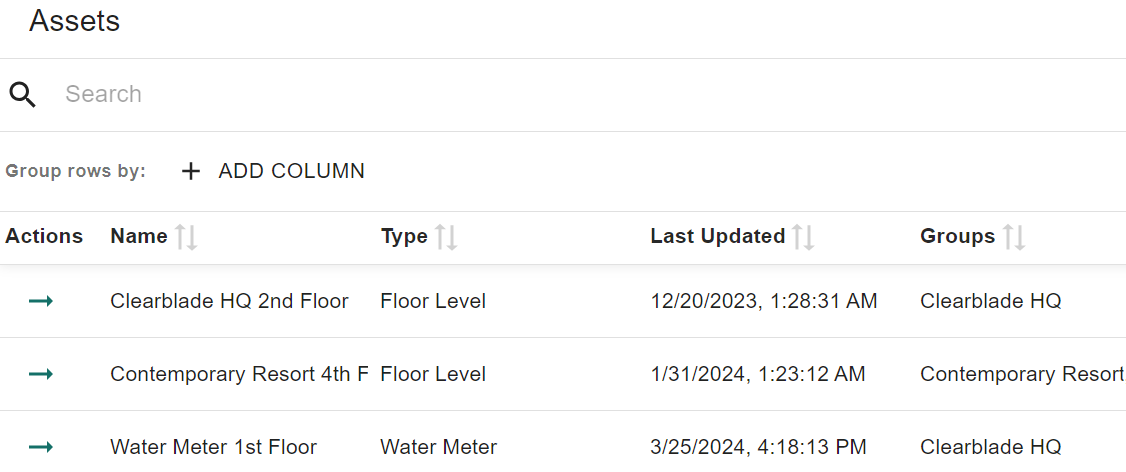
Asset list
-
Click Assets on the left menu:
-
Your assets display. You can search or filter the assets you are looking for:
Search Filter
-
This is what displays when you click the filter icon:
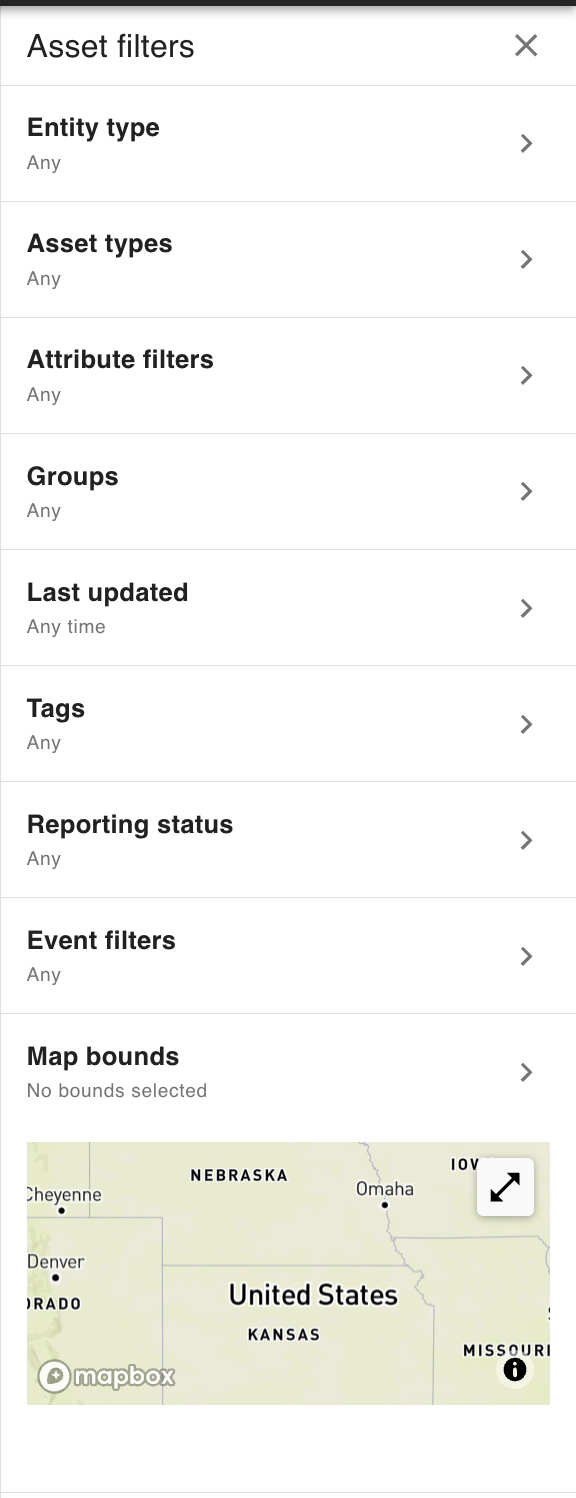
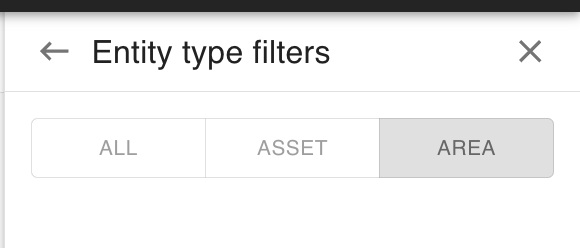
You can filter by entity type to view only assets or only areas:
You can filter by as many asset types and groups as you want. Here is an example attribute filter: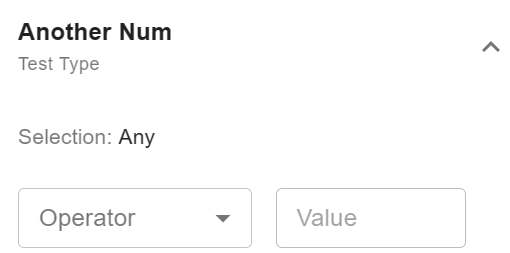
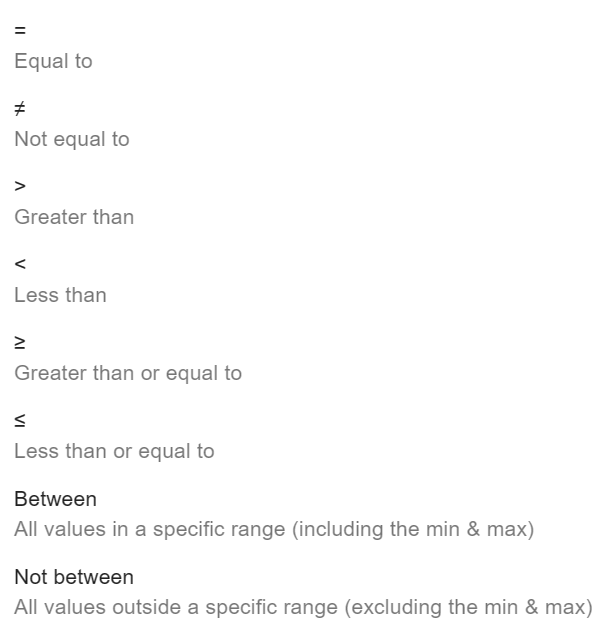
These are your options when you select operator:
This appears when you click the last updated filter: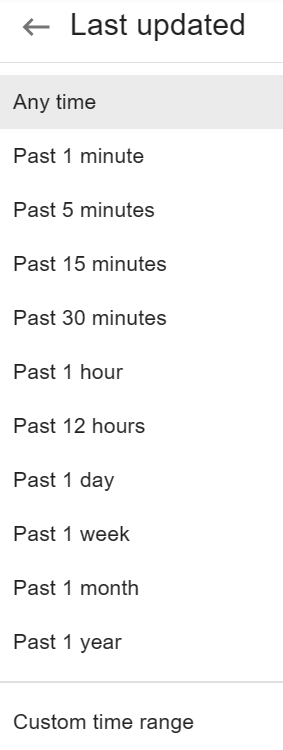
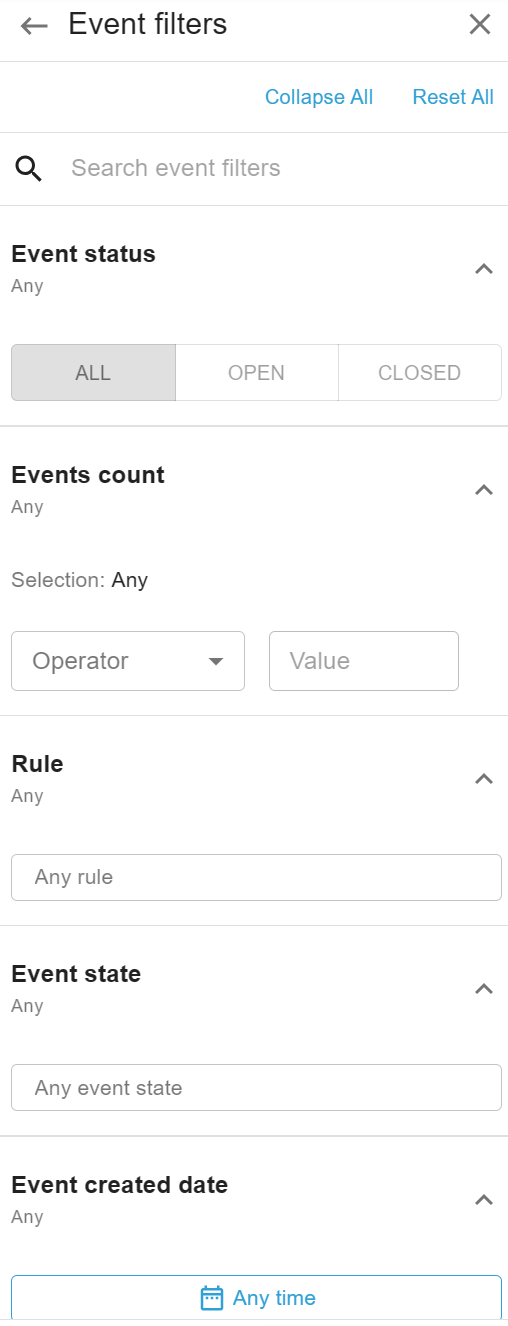
These are some of the event filter options:
Here is an example of the event filters filled out: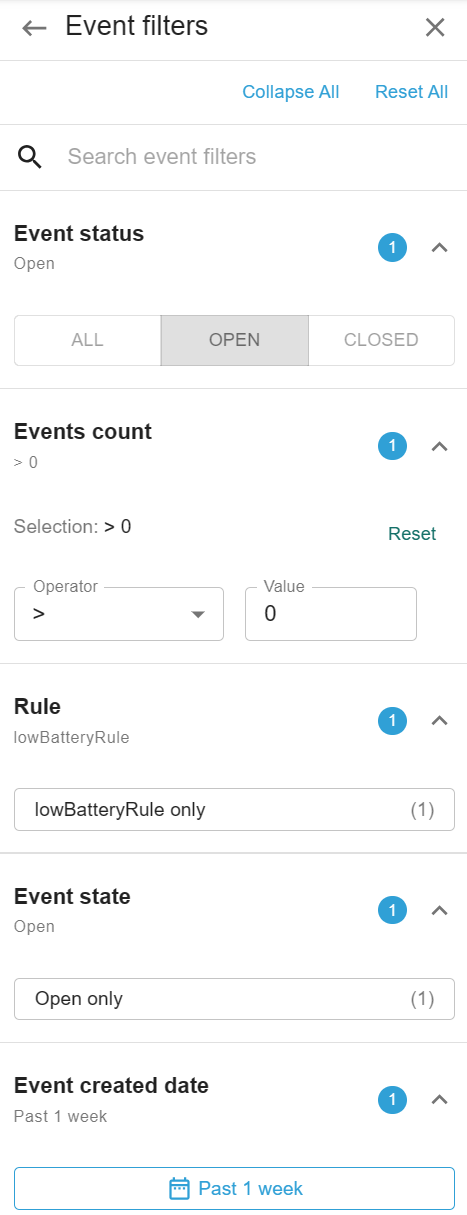
Here are more event filters you can use when you scroll down: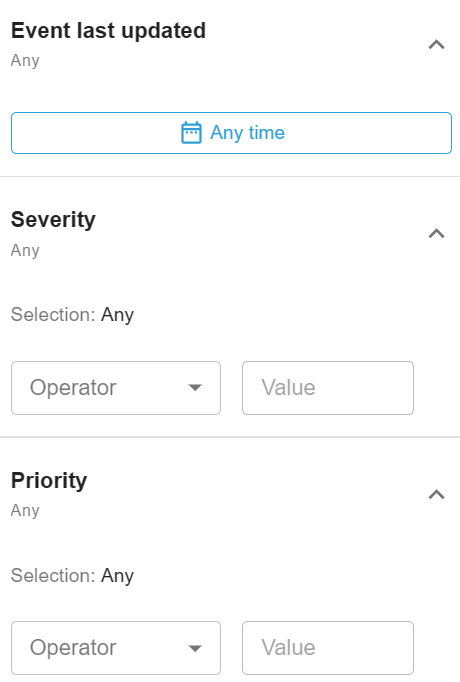
This is what appears when you click the map bounds filter: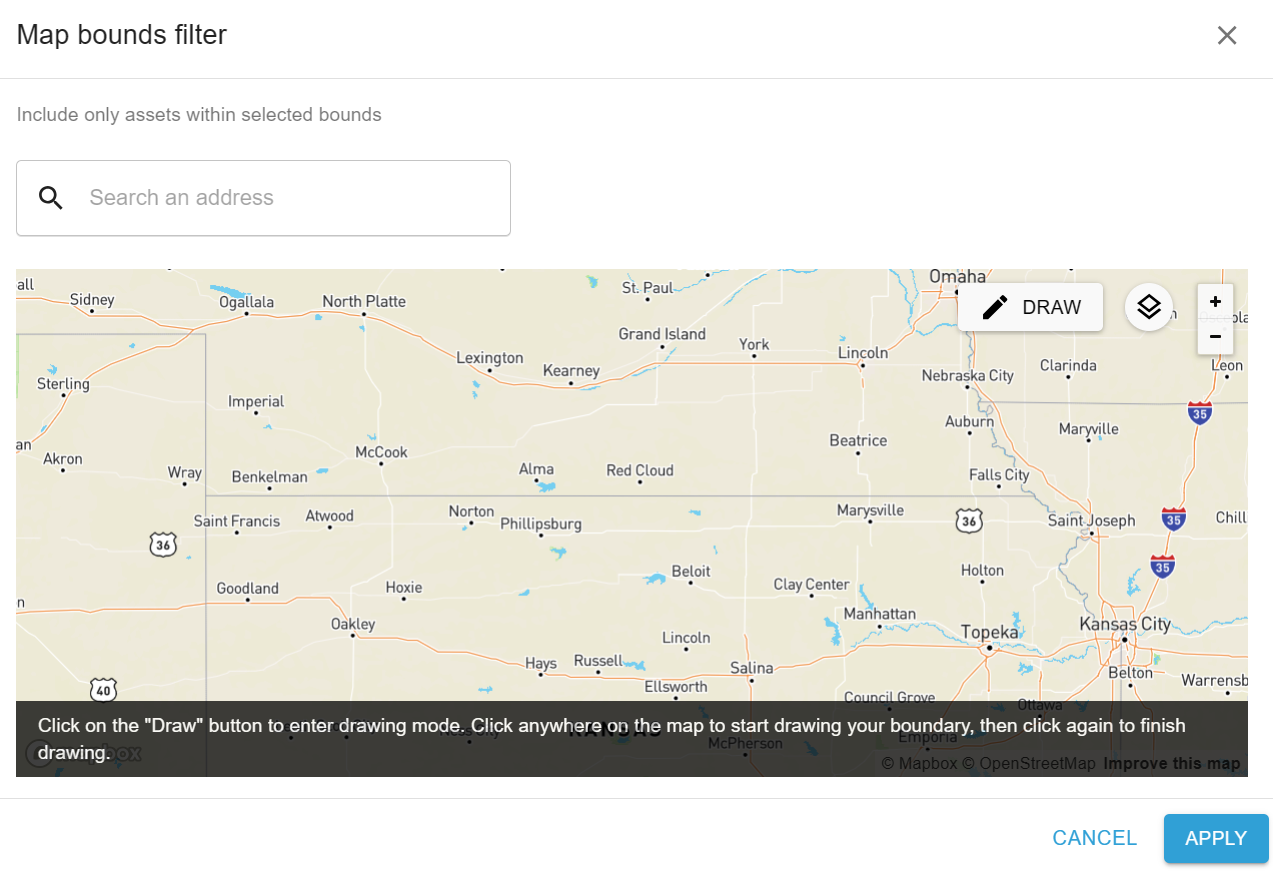
Click the controls icon to see your various options:
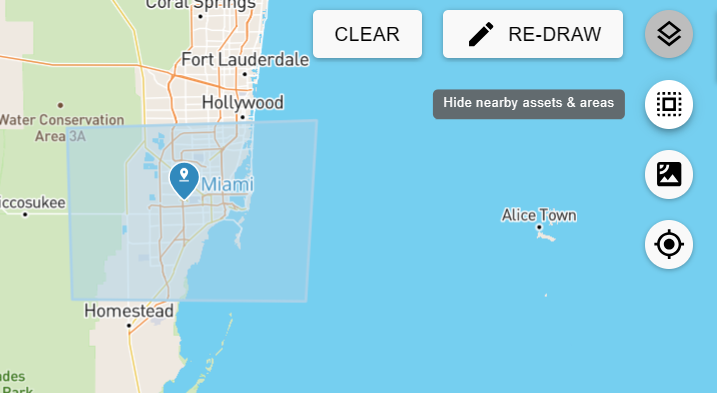
Here is an example of what appears when the show nearby assets & areas icon,
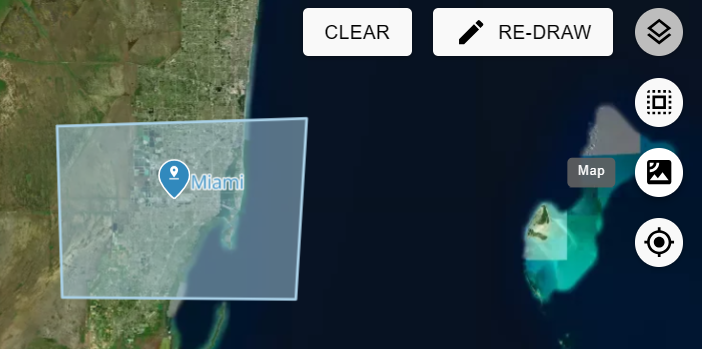
Here is an example of what appears when the satellite icon,
Click the move to my location icon,
Zoom in and out by using the plus and minus icons:
-
Click the vertical ellipsis icon,

Click the group rows icon,
Click the expand arrows,

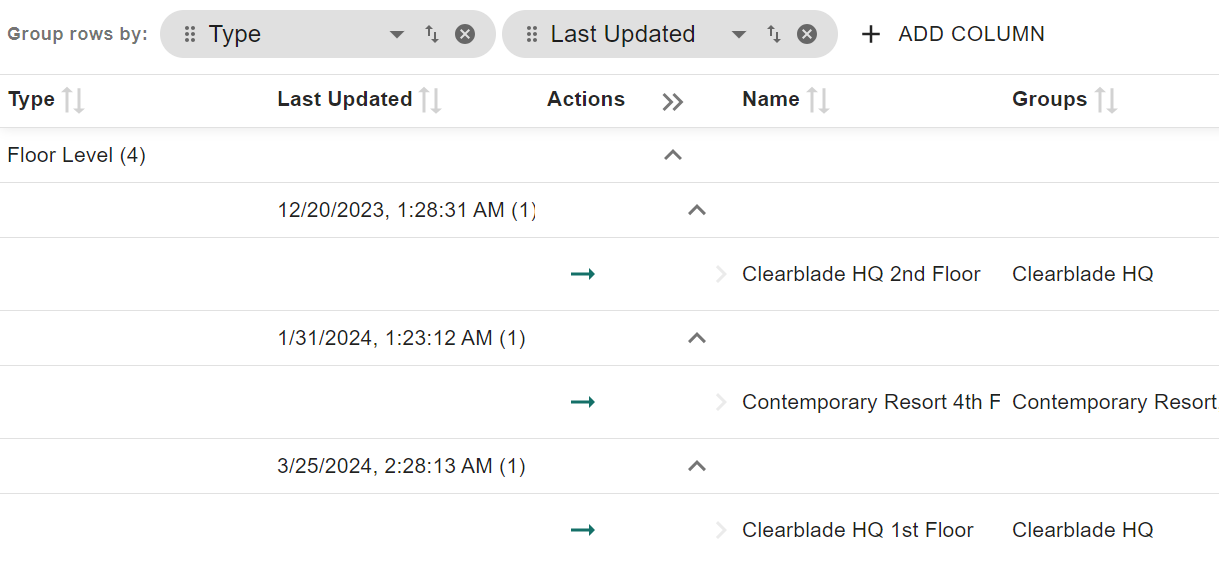
You can change the order of the grouping by moving the columns to the right or left of each other. For instance, you can drag type to the right of last updated:

Asset details
-
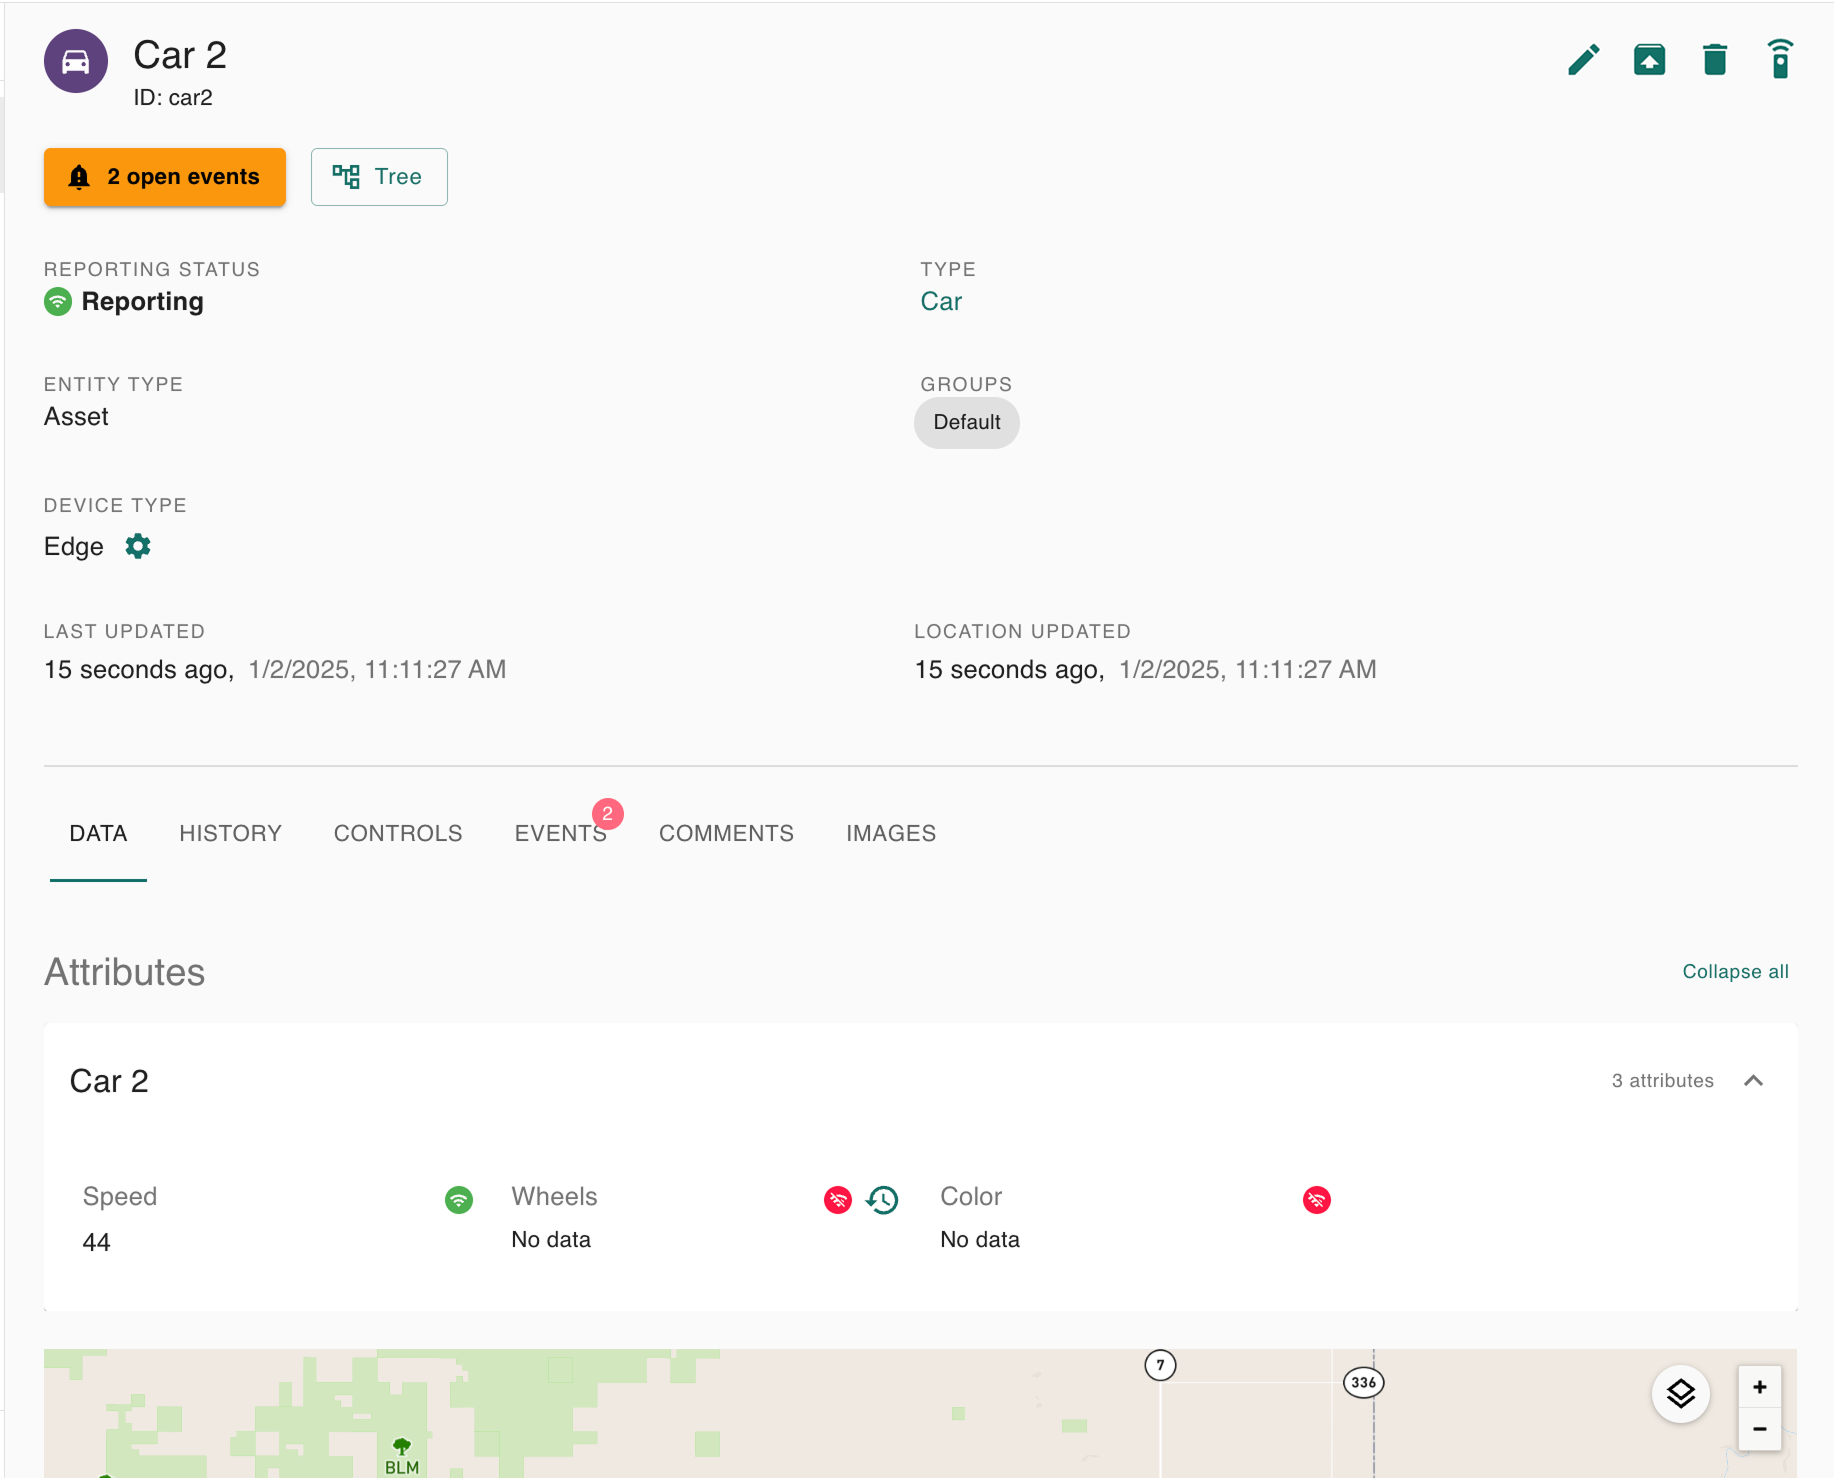
Here is an asset example:
-
Data is listed within the data tab:
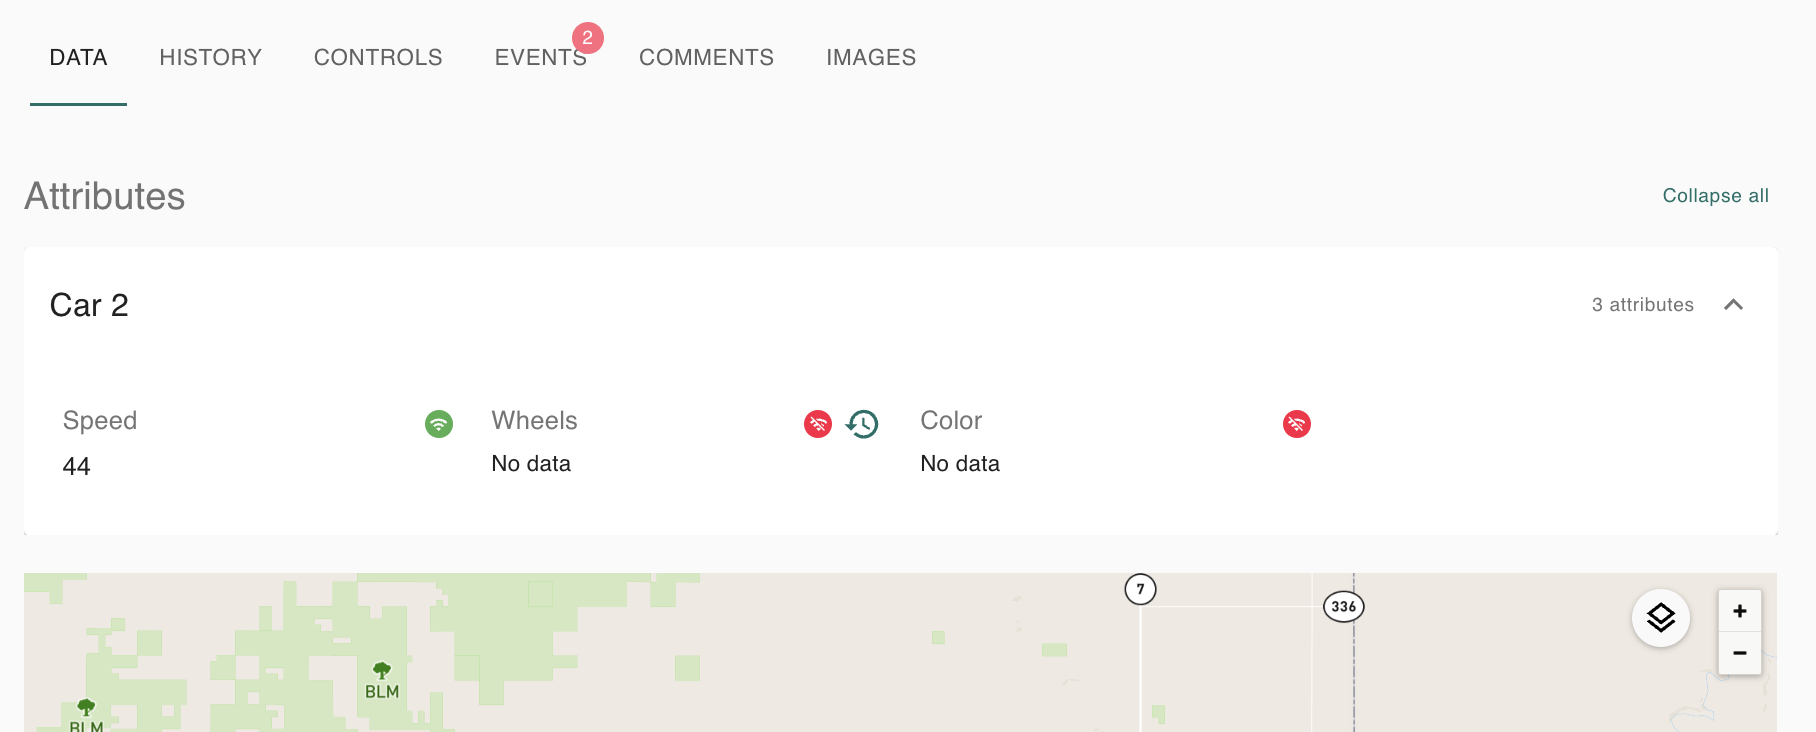
In this example, click the attribute history icon to view the attribute’s history:
-
Historical information is listed within the history tab:
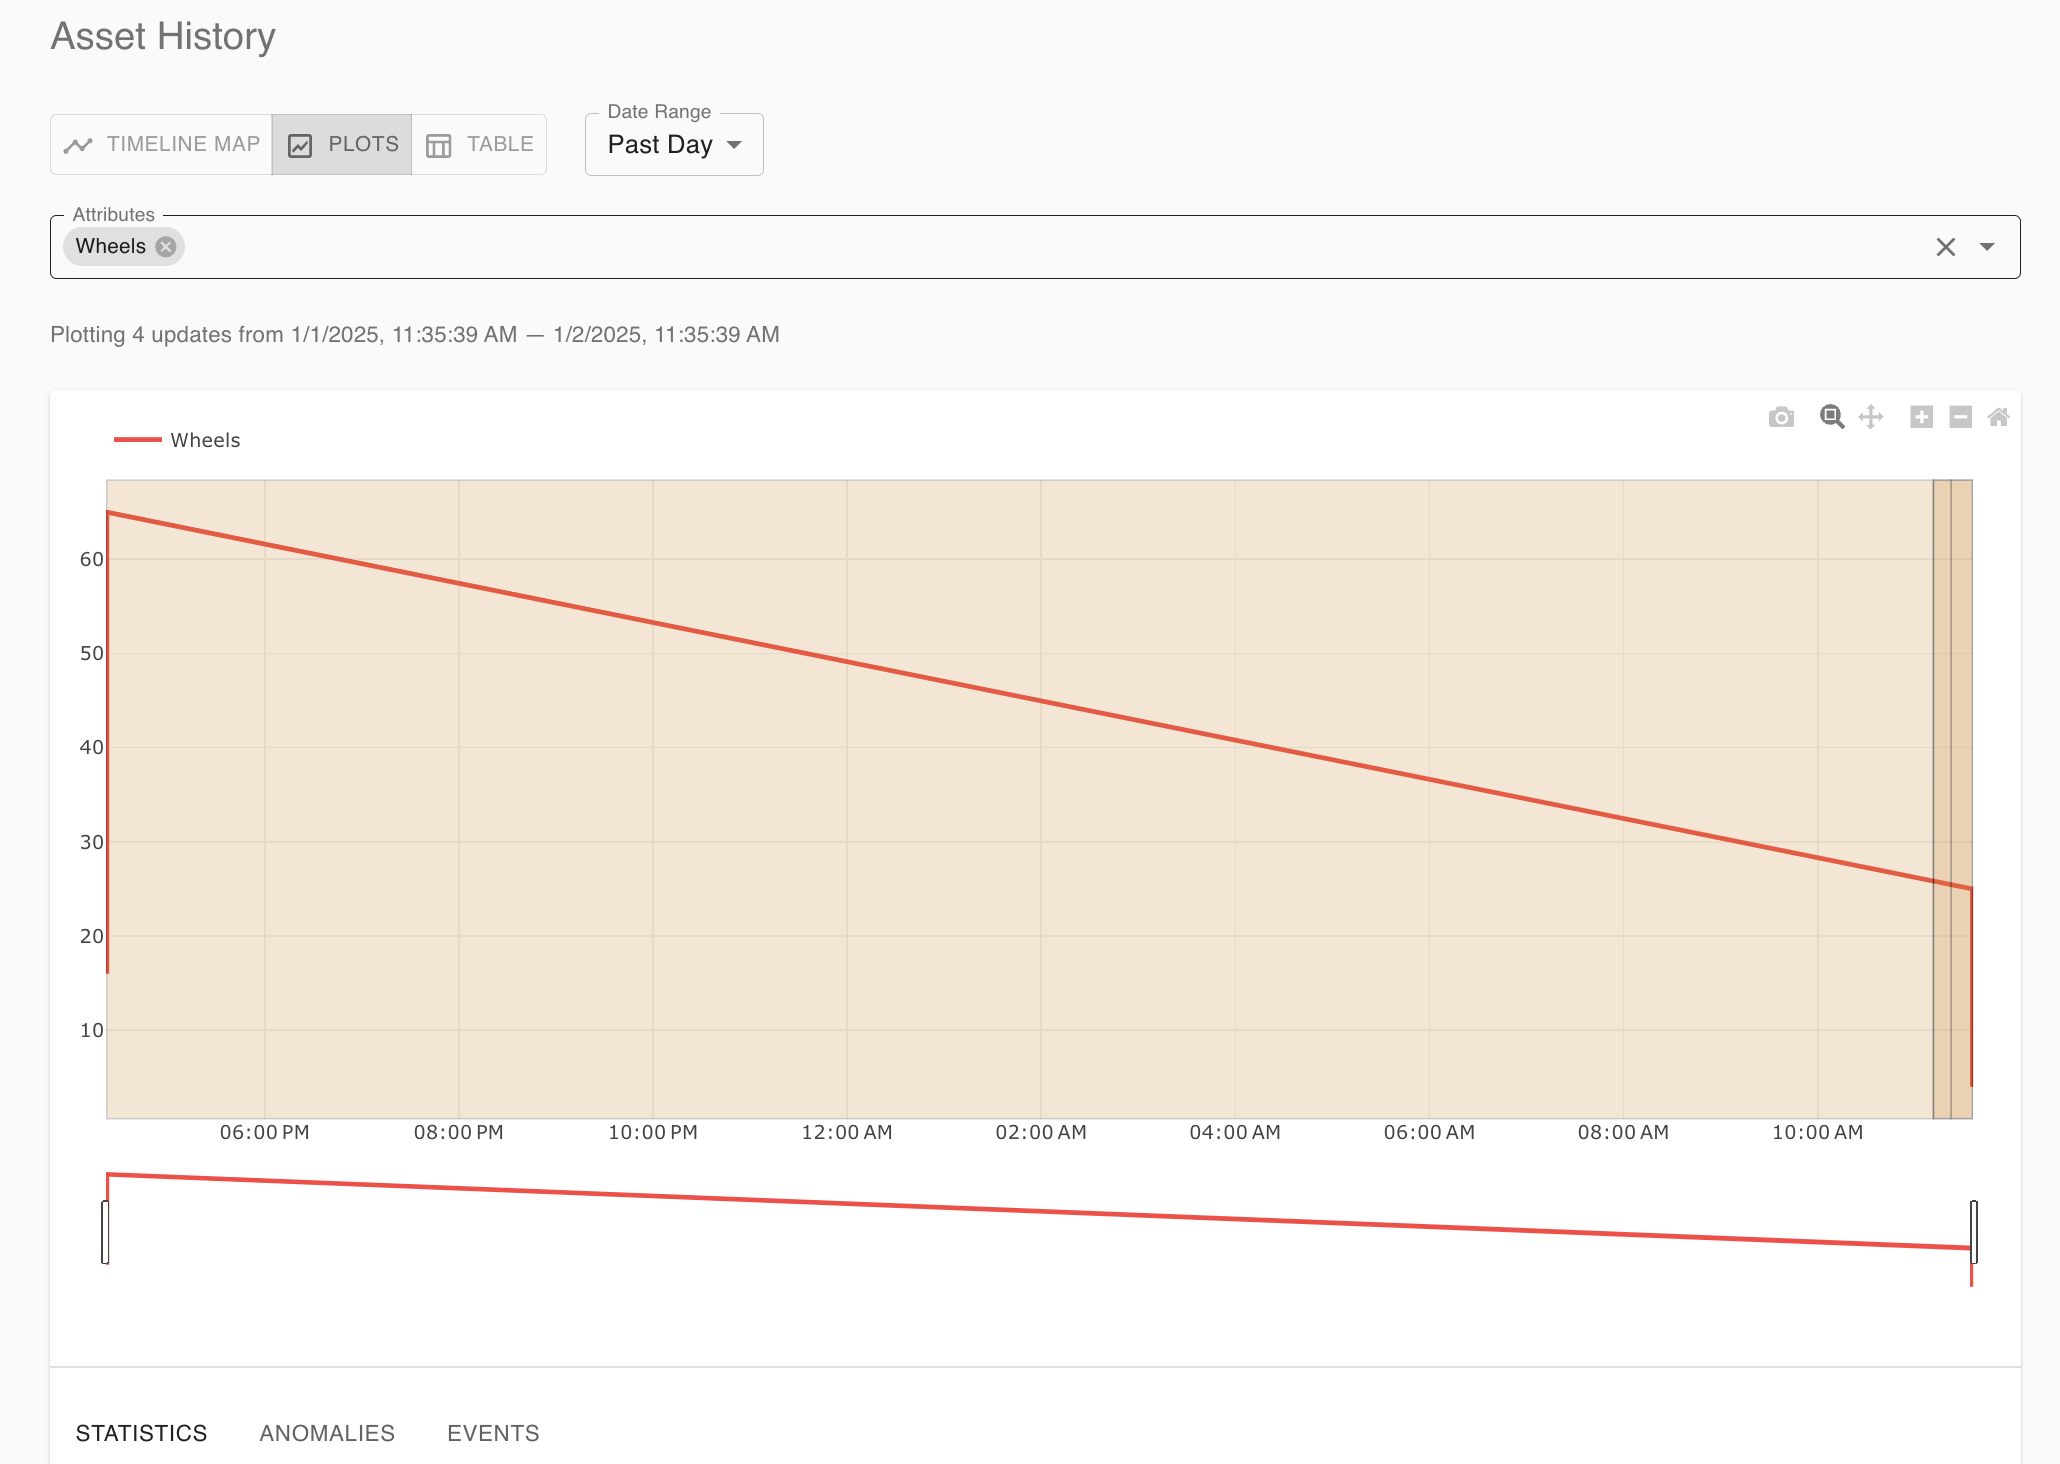
You can switch from plots to timeline maps or tables. You can also specify a date range and search for certain attributes.
-
Control information is listed within the controls tab:
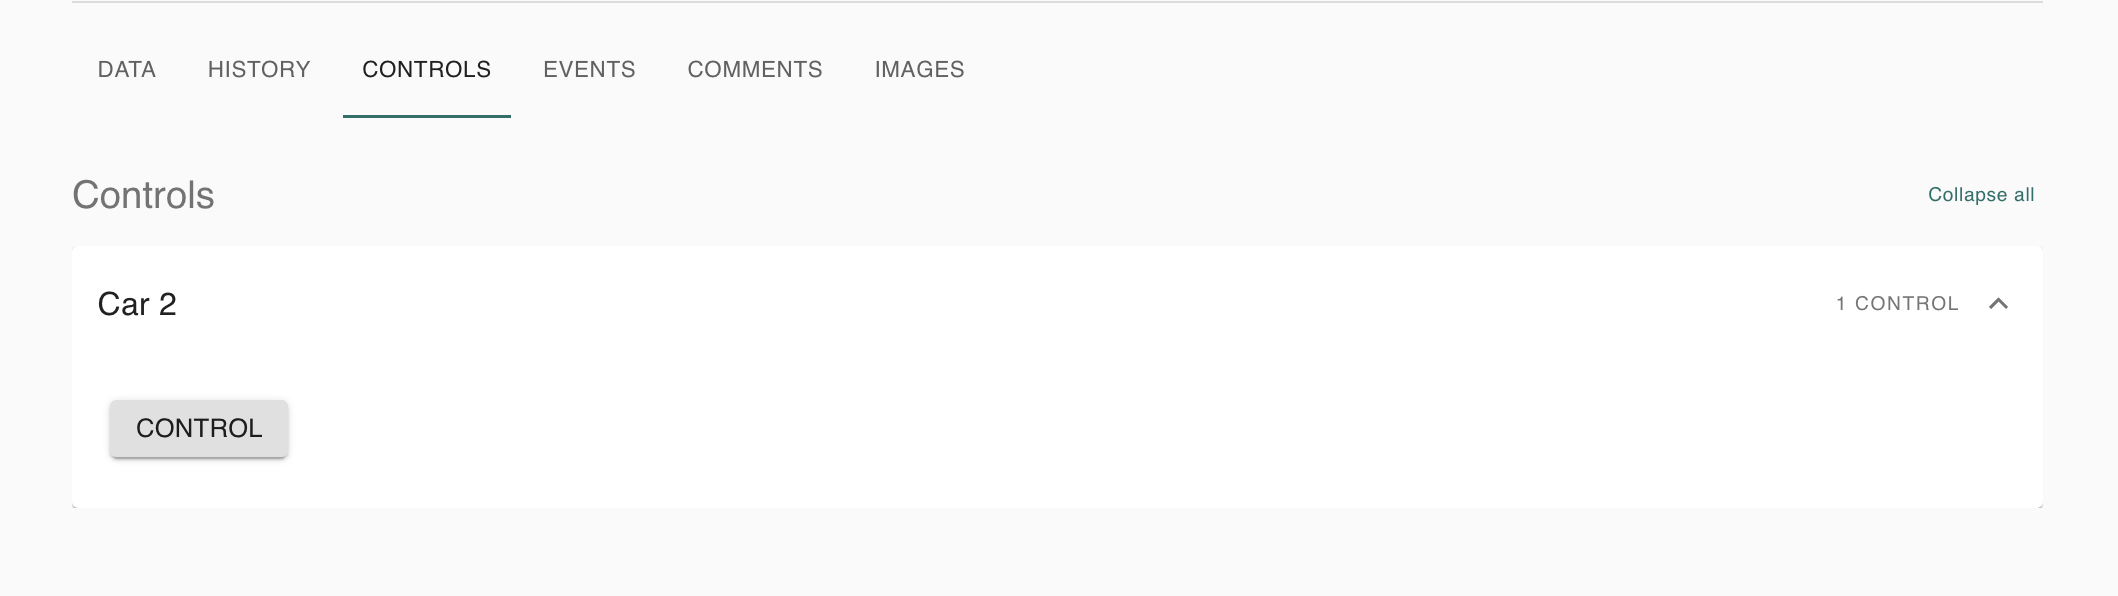
Controls allow you to interact with and perform various actions on an asset (turn on/off a light, request logs, etc.)
-
Event information is listed within the events tab:
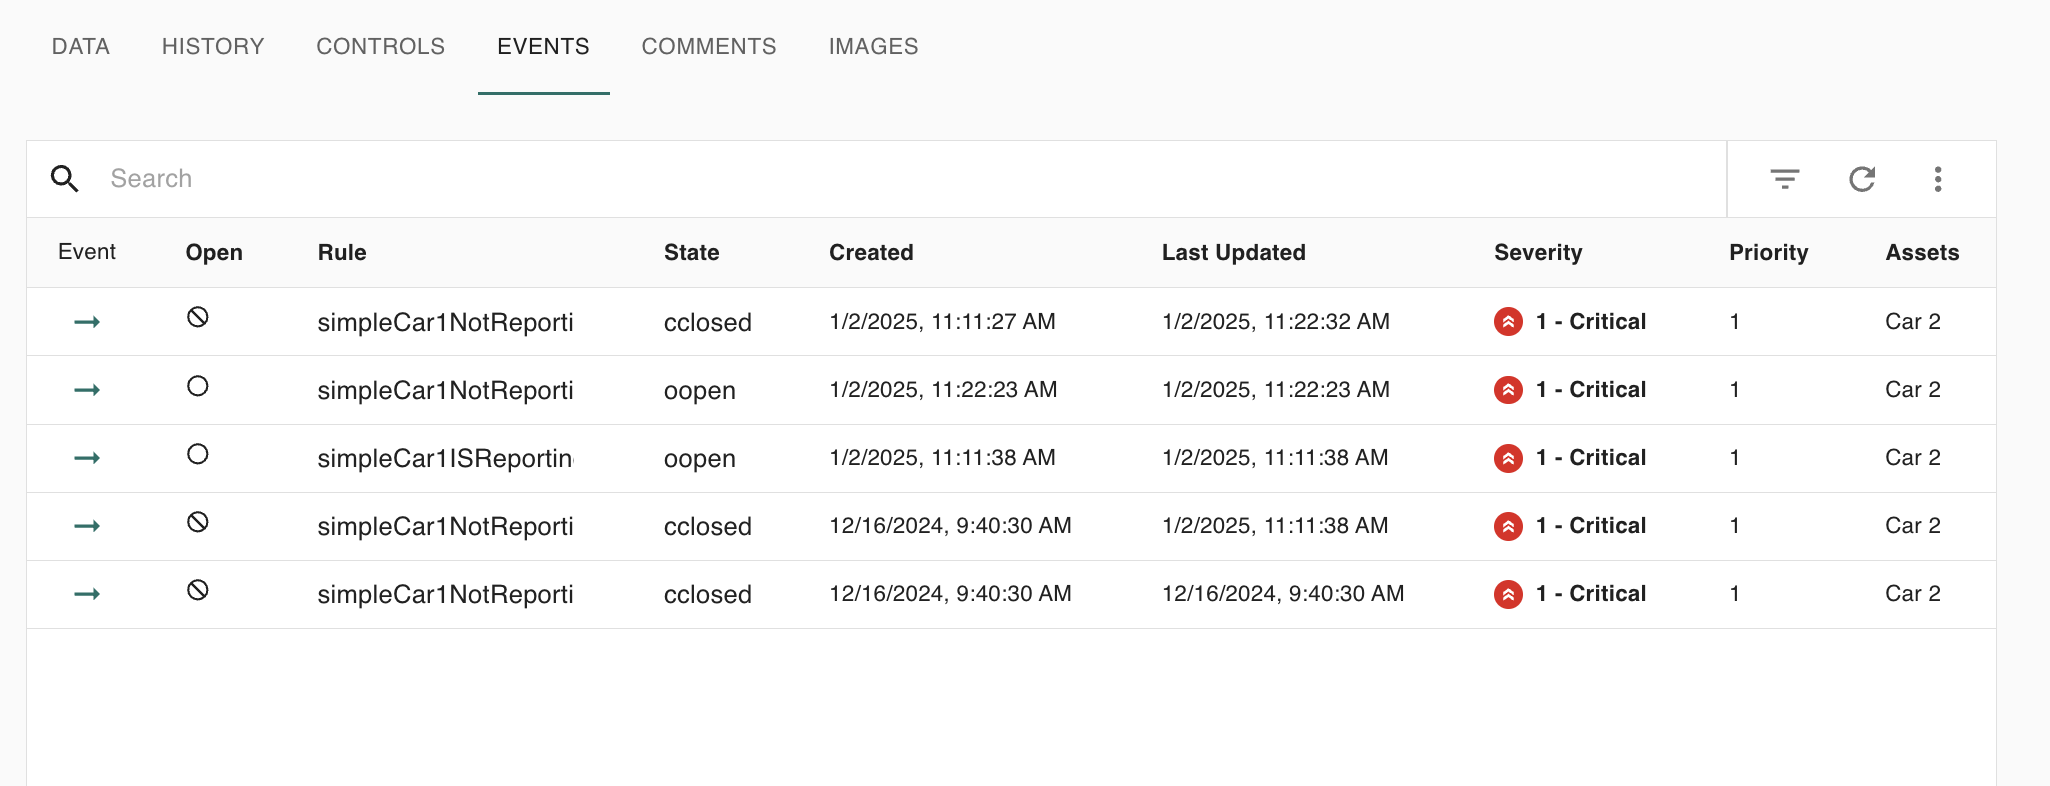
The refresh icon on the top right of the table refreshes it. The ellipsis icon allows you to edit the table’s columns.
-
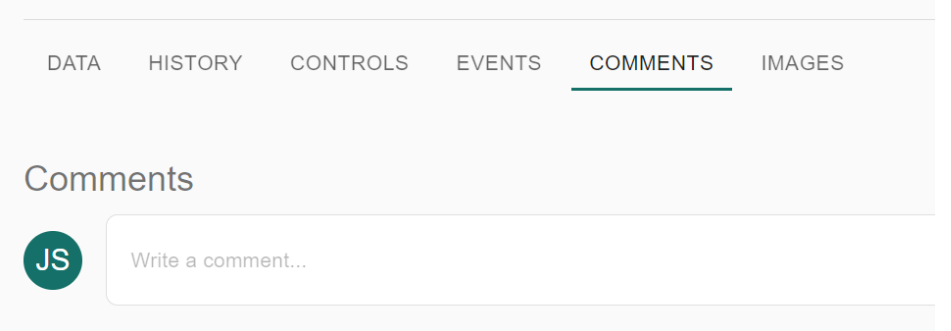
You can add comments within the comments tab:
-
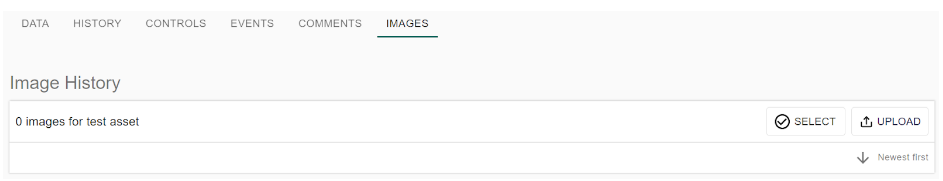
You can add an image within the images tab:
-
Click the simulate icon on the top right of the asset’s page to simulate your asset:
-
Click the archive icon on the top right of the asset’s page to archive your asset:

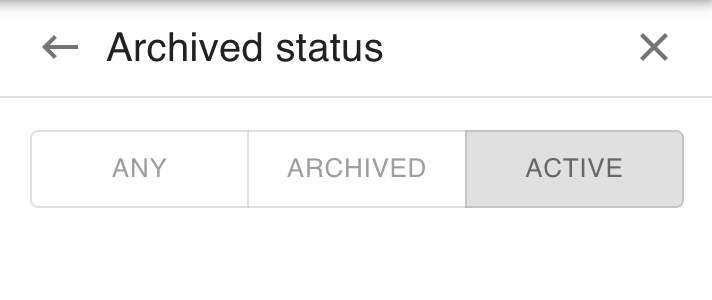
By default, archived assets are hidden. To view them, you can use the ‘Archived status’ filter to display only archived assets (Archived) or to show all assets (Any).
Archiving a parent asset will also archive all of its child assets in the lineage.