
This feature allows you to view your asset’s historical data across time and compare it to other assets in the tree.
Select attributes
Select the attributes you would like to plot from the dropdown:
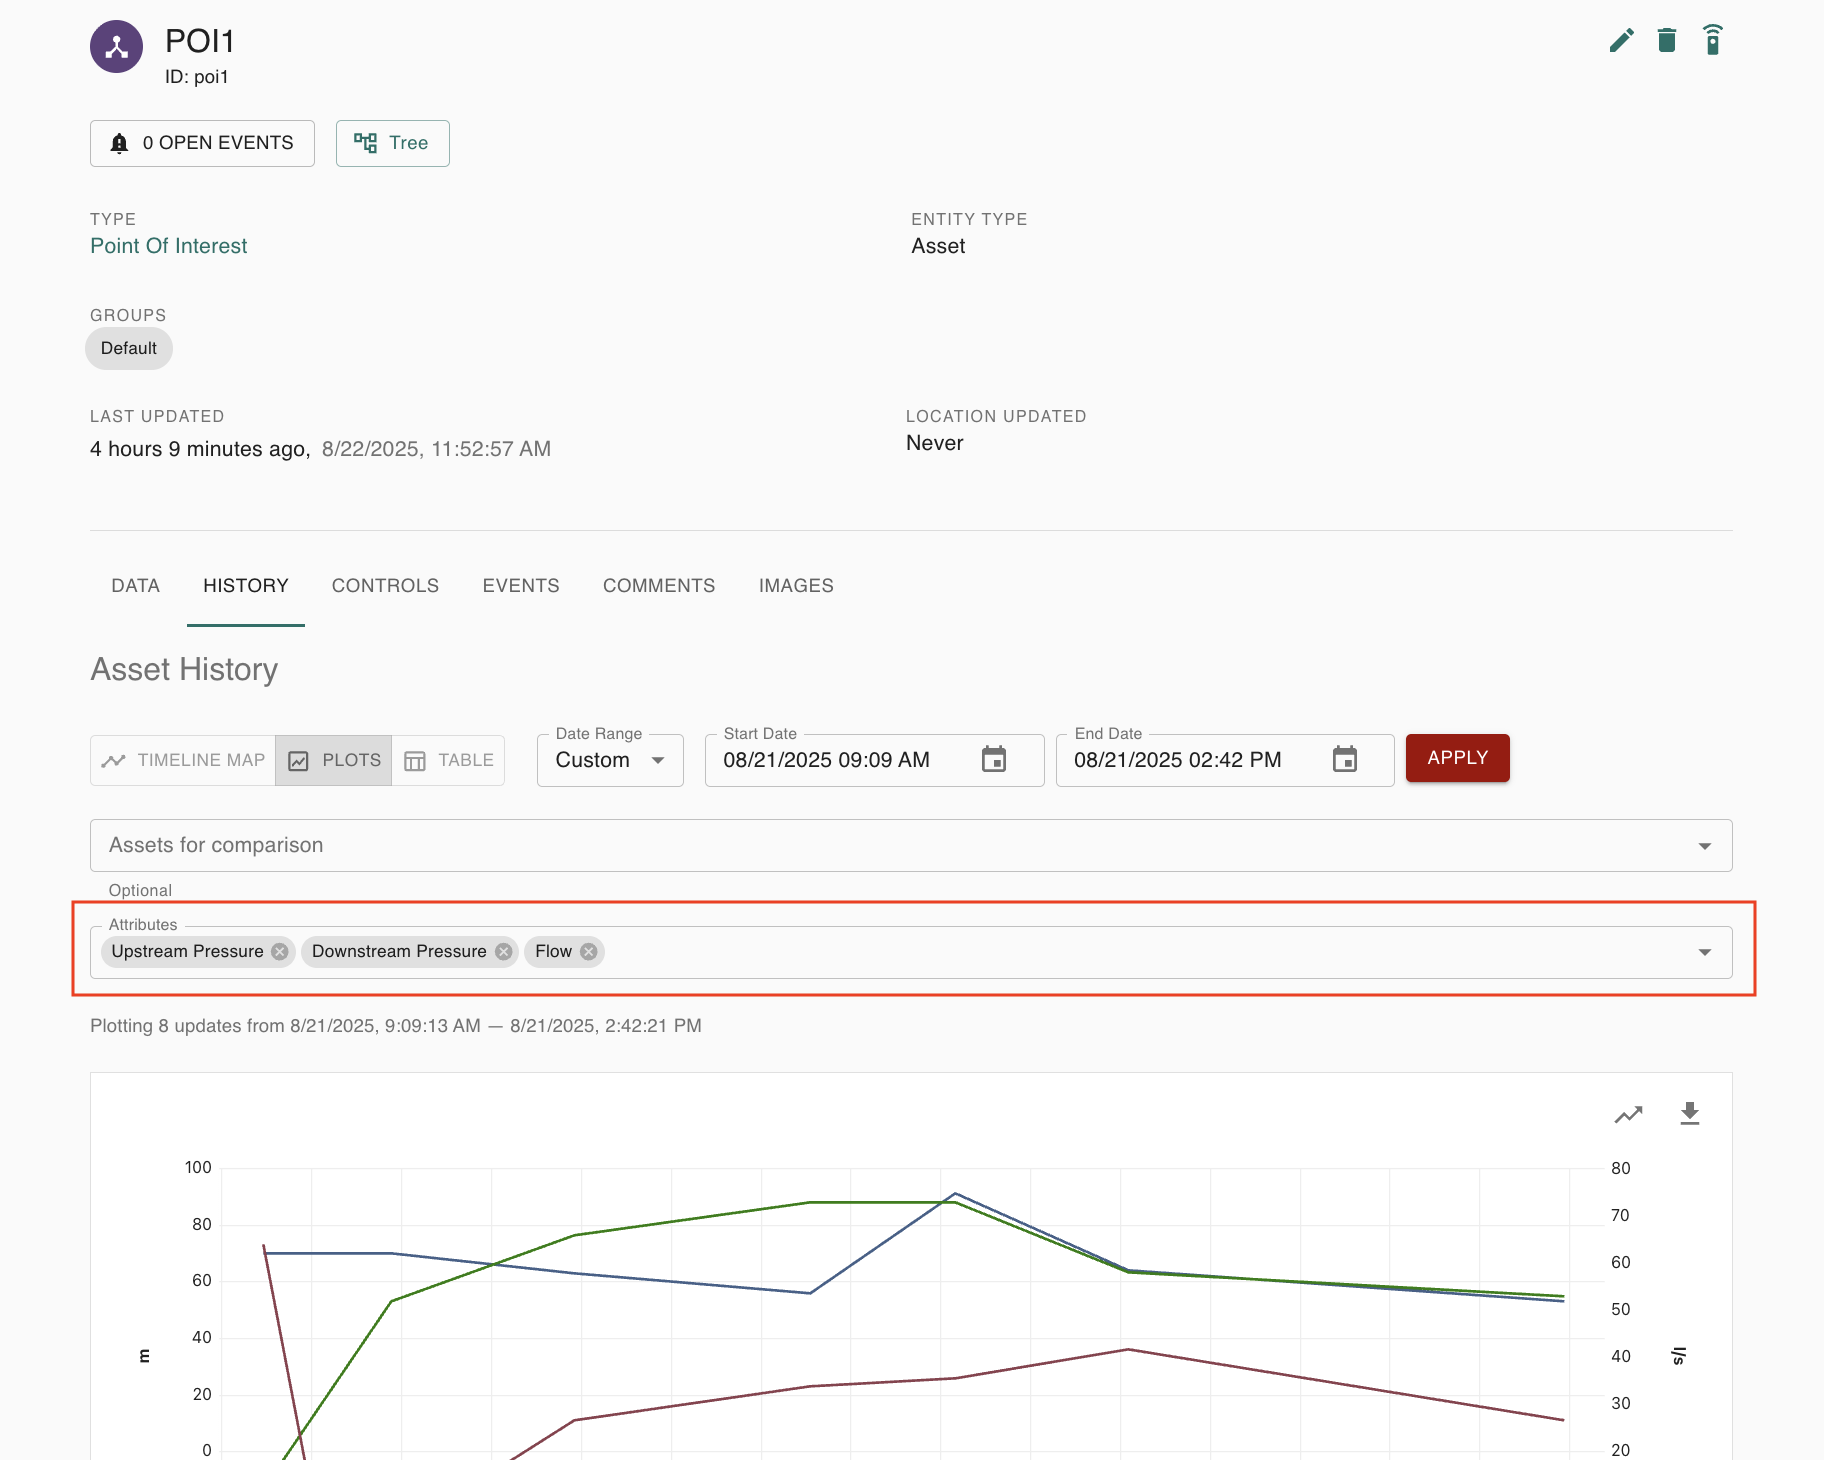
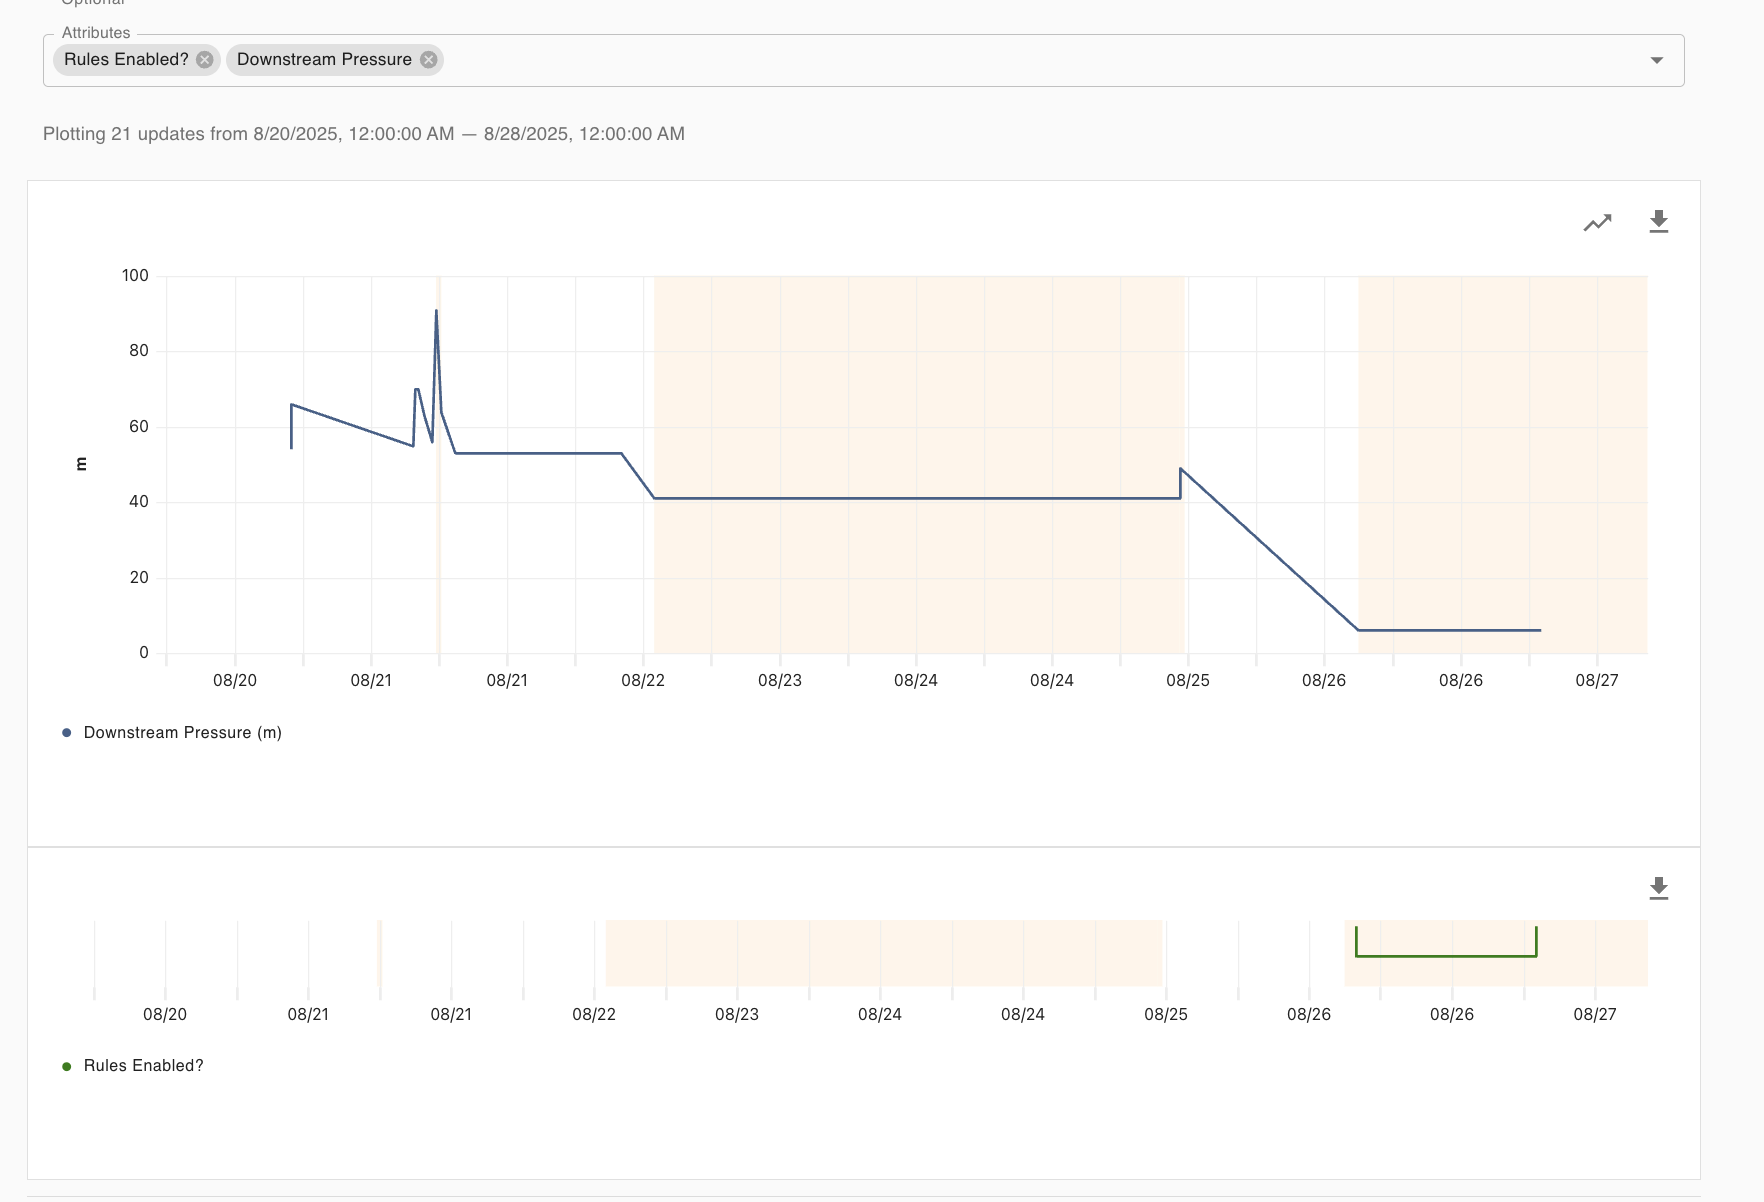
The available attributes will be limited to numerical and boolean types. If you select both types, they will display on separate plots for clearer viewing:
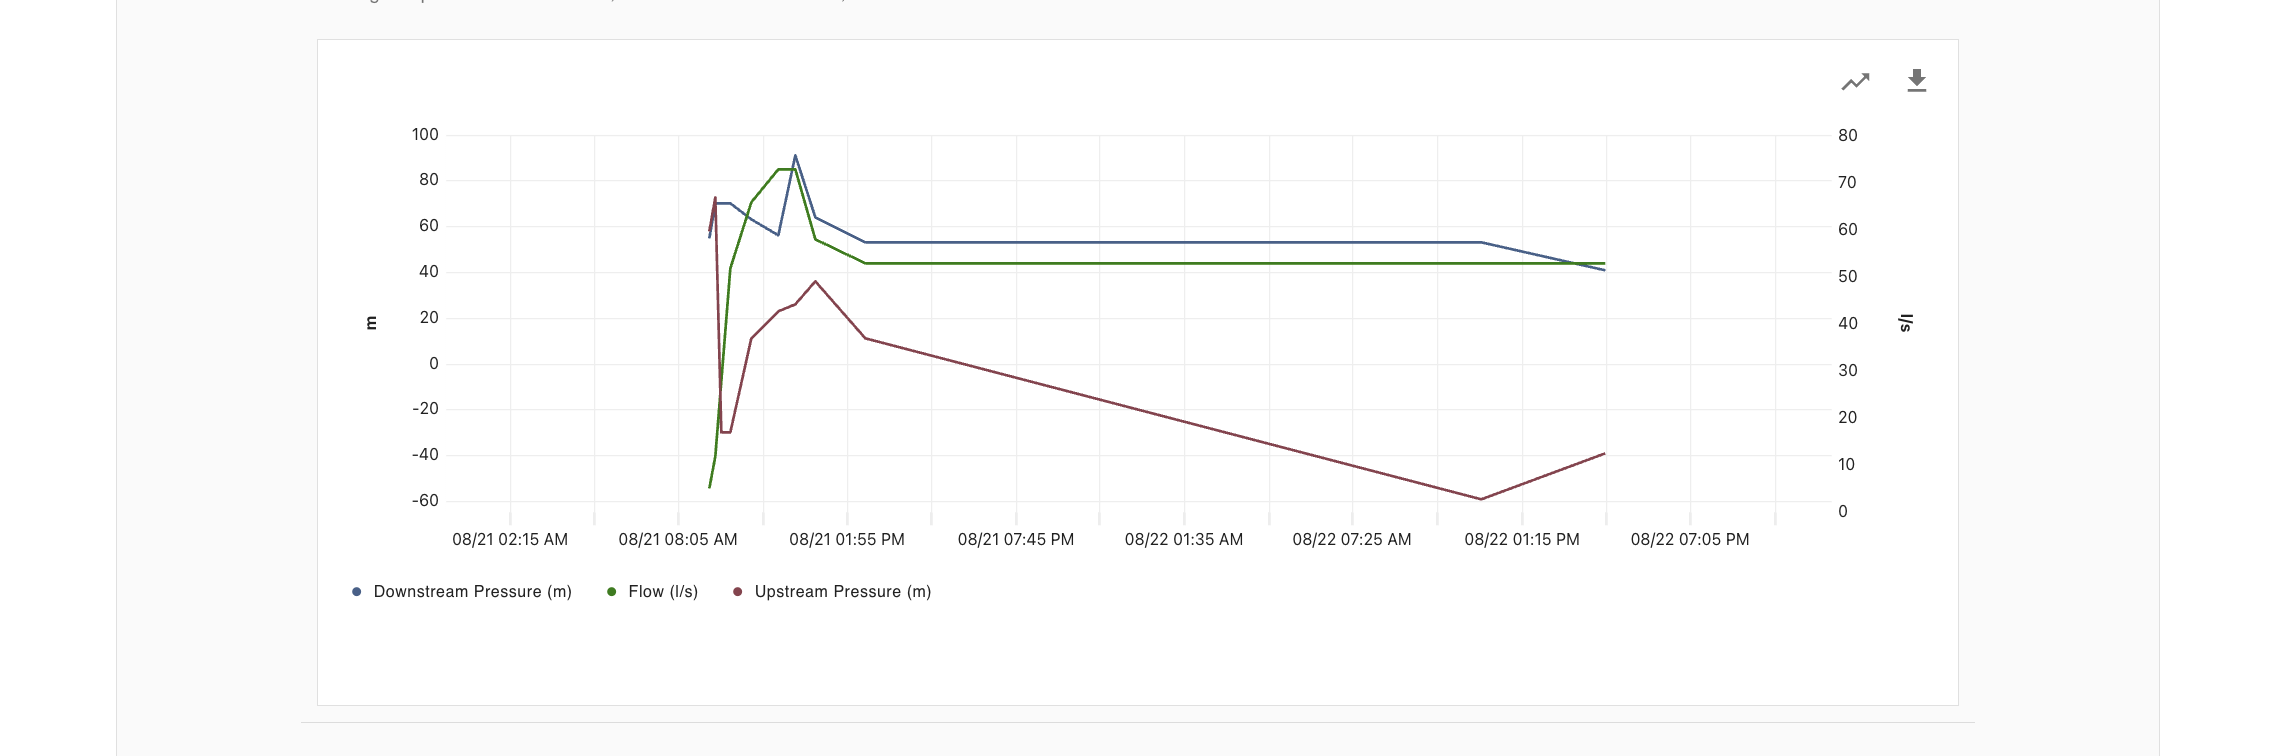
If the numerical attributes you are viewing have have different custom units, your graph will display a separate y-axis per unit. Each axis will begin at 0 by default, or accommodate the lowest negative value in your data, though you can drag them to adjust if you’d like.
Adjust the time range
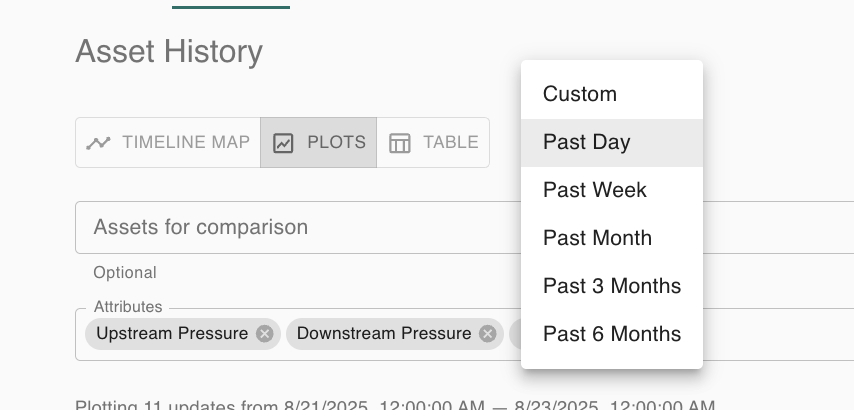
You can select various time ranges from the dropdown.
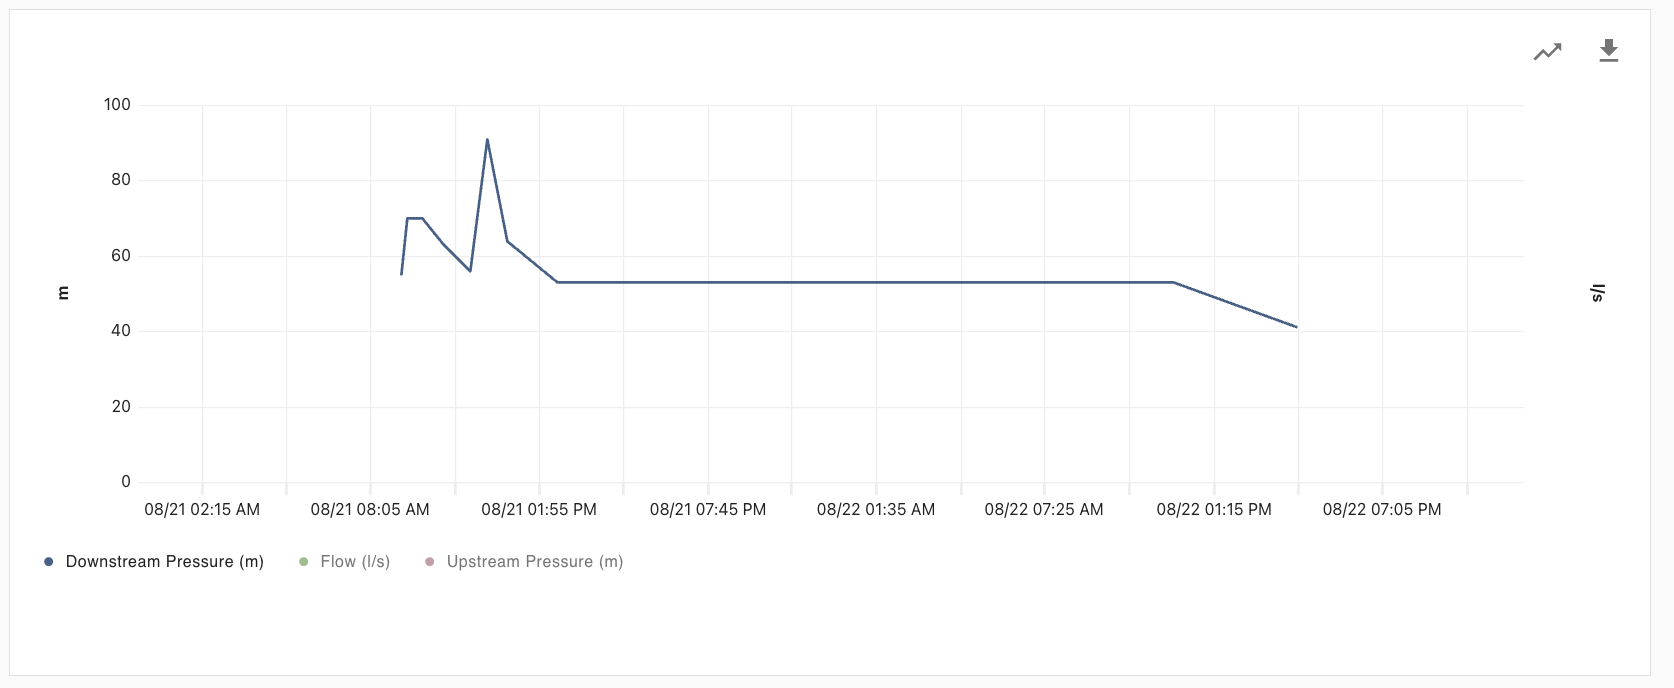
You can also click and drag the chart to zoom into a particular time range:
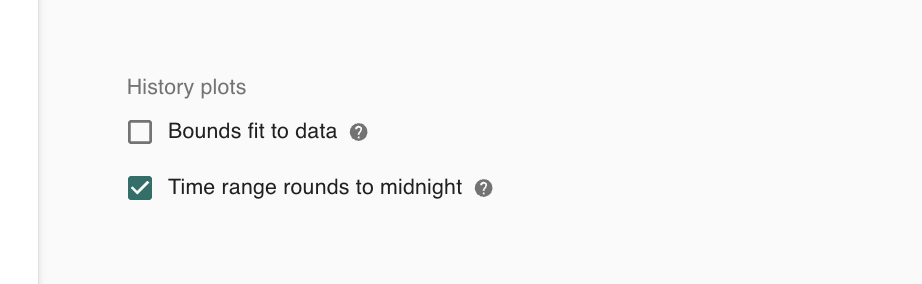
Based on the system settings your administrator has selected, your plot may handle time ranges differently:
-
Bounds fit to data:
-
When enabled, your chart’s left and right bounds will shrink to fit the data that is returned, rather than showing your entire time range, when the data does not span the complete time range.
-
When disabled, your chart will always display the complete time range, even when there may be data missing for portions of it.
-
-
Time range bounds to midnight:
-
When enabled, your chart will return data from midnight to midnight of any relative range you have selected. This will not affect custom, absolute ranges selected. (e.g. Requesting “Past day” at 4:33pm will return data from 12am of the previous day until 12am of tomorrow).
-
When disabled, your chart will return data from the exact relative range selected (e.g. Requesting “Past day” at 4:33pm will return data from 4:33pm of the previous day until 4:33pm today).
-
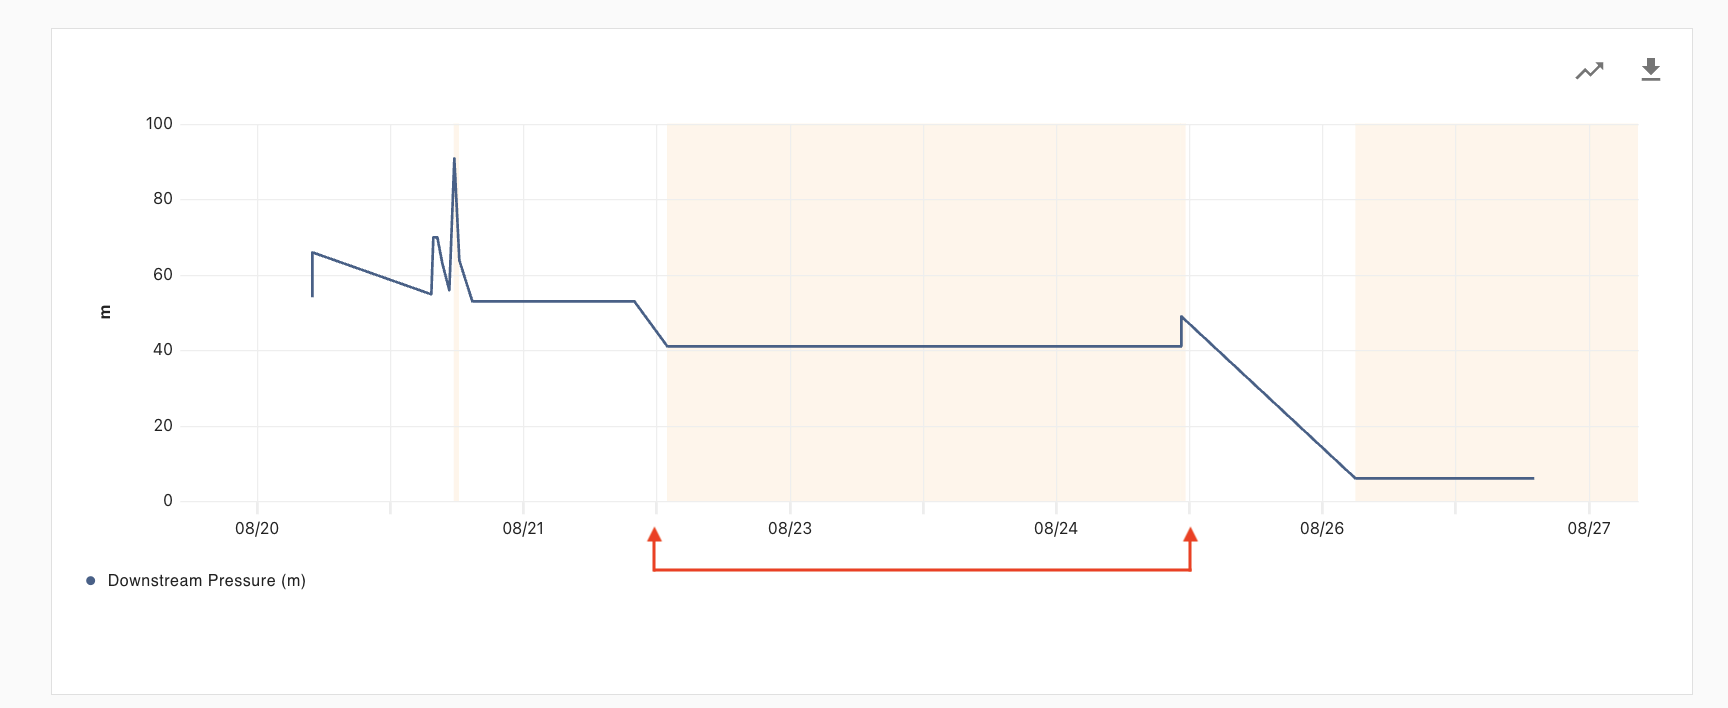
View events alongside data
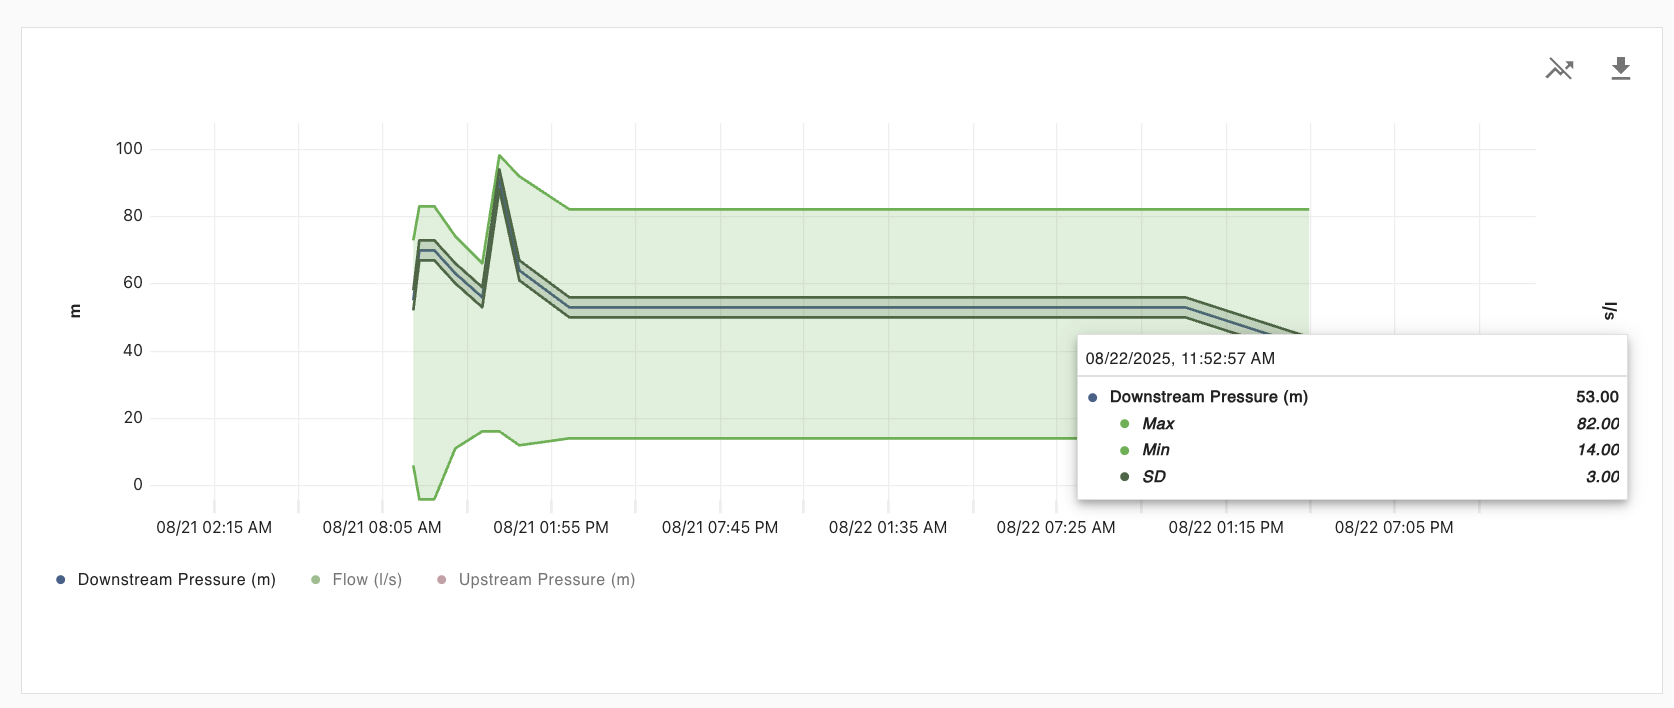
If there were open events during at period of time for your data, your chart will display a shaded area of the system’s default event color.
Custom data visibility
You can temporarily hide and show attributes by clicking on their name in the legend.
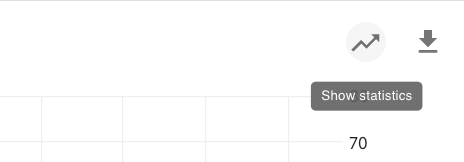
You can show and hide any statistics associated with your attribute data by clicking the statistics icon in the top right corner of the chart.
Compare data across assets
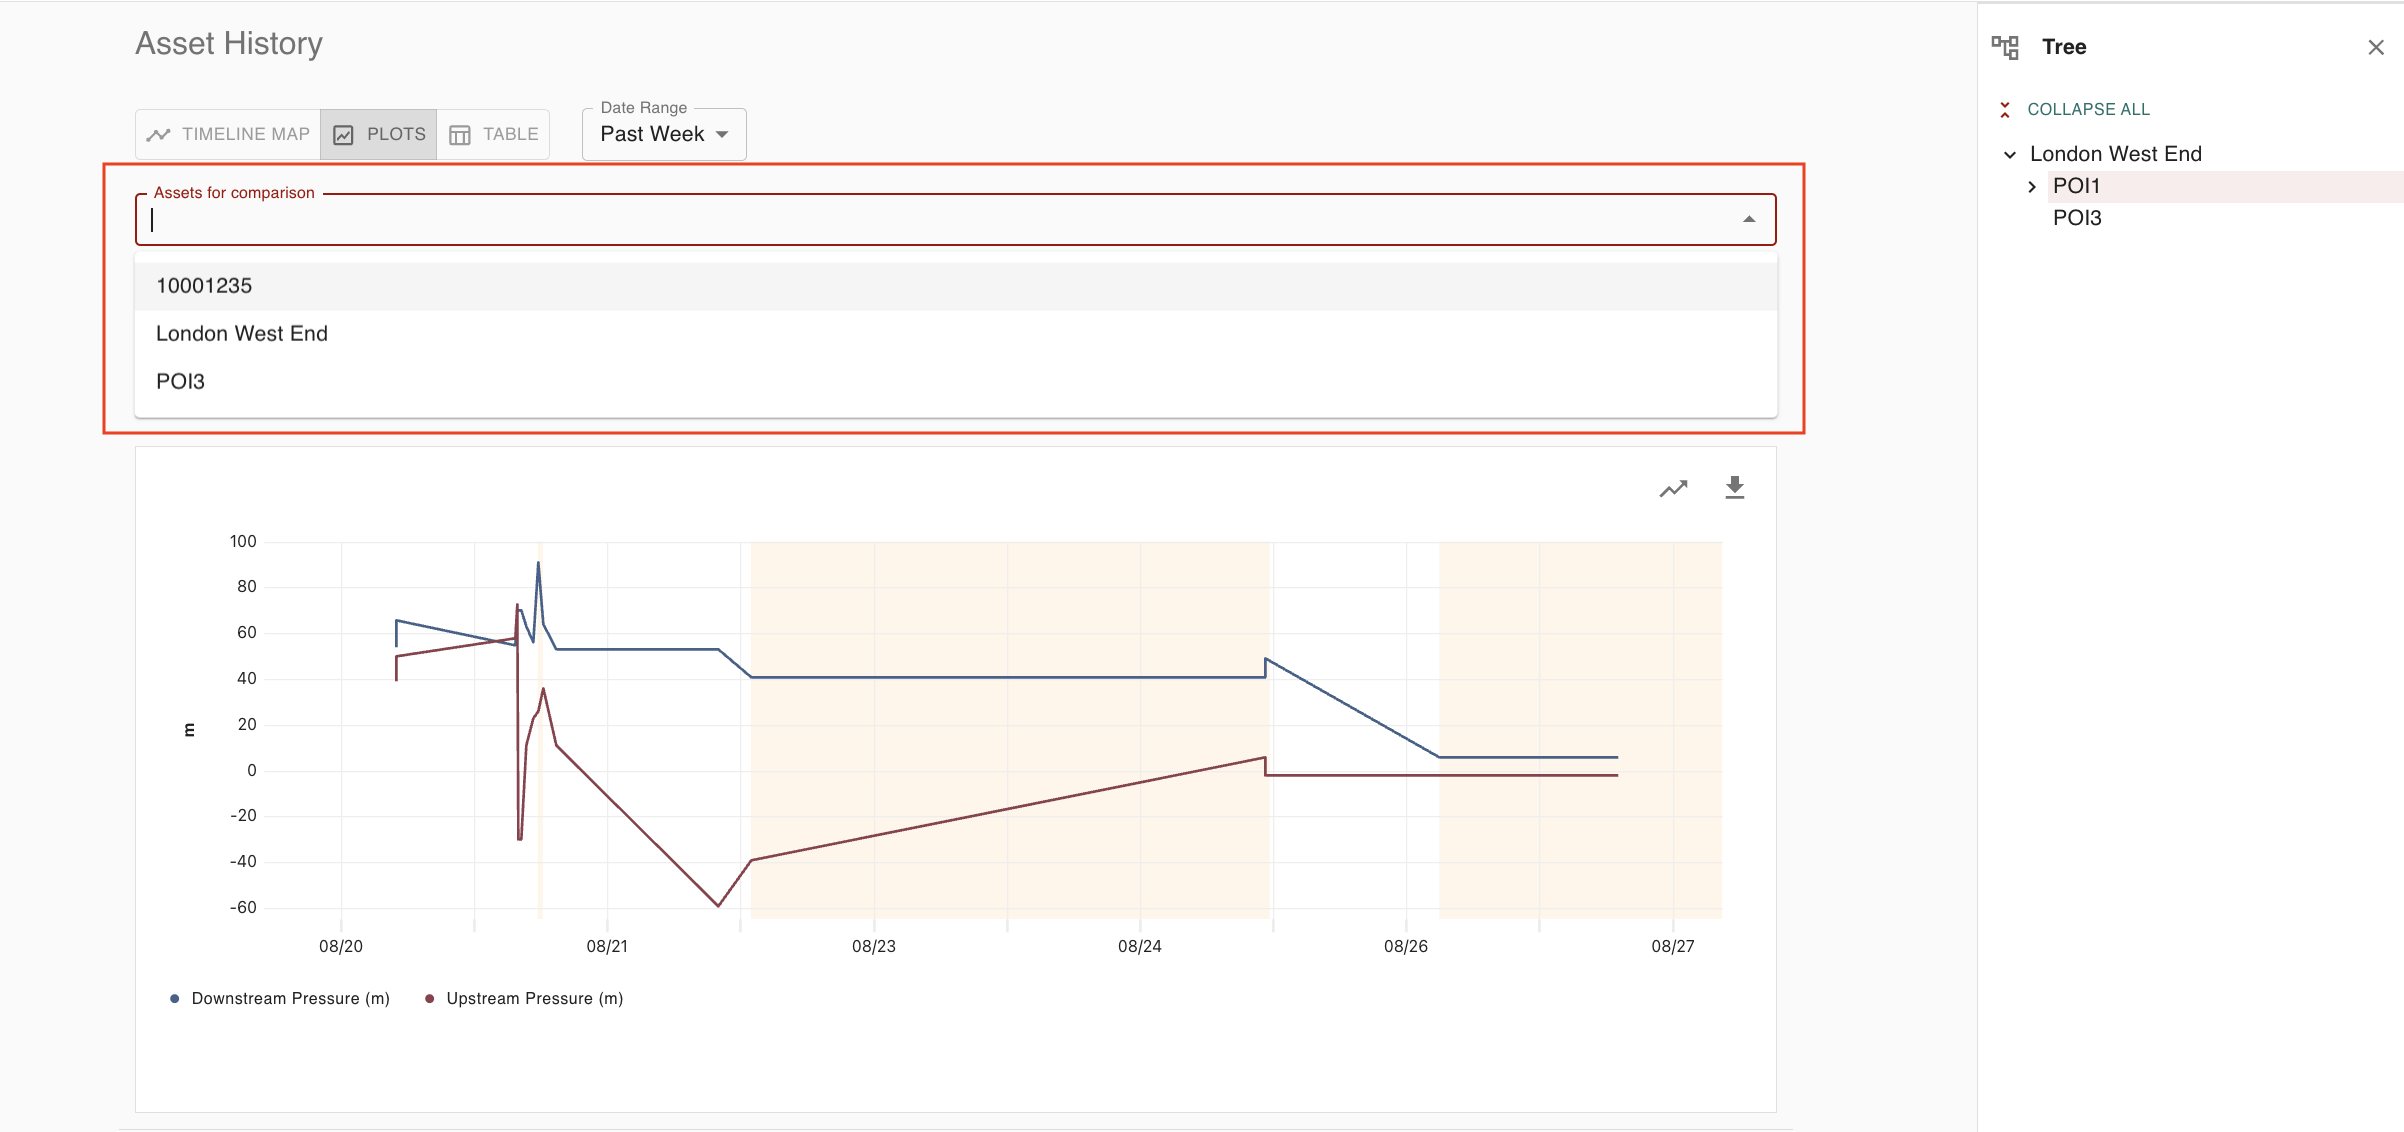
Select the comparison assets you would like to include in the plot. You can compare against any assets within the tree of the asset you are currently viewing. Selecting an asset of a different type will update the available options in the attributes dropdown:
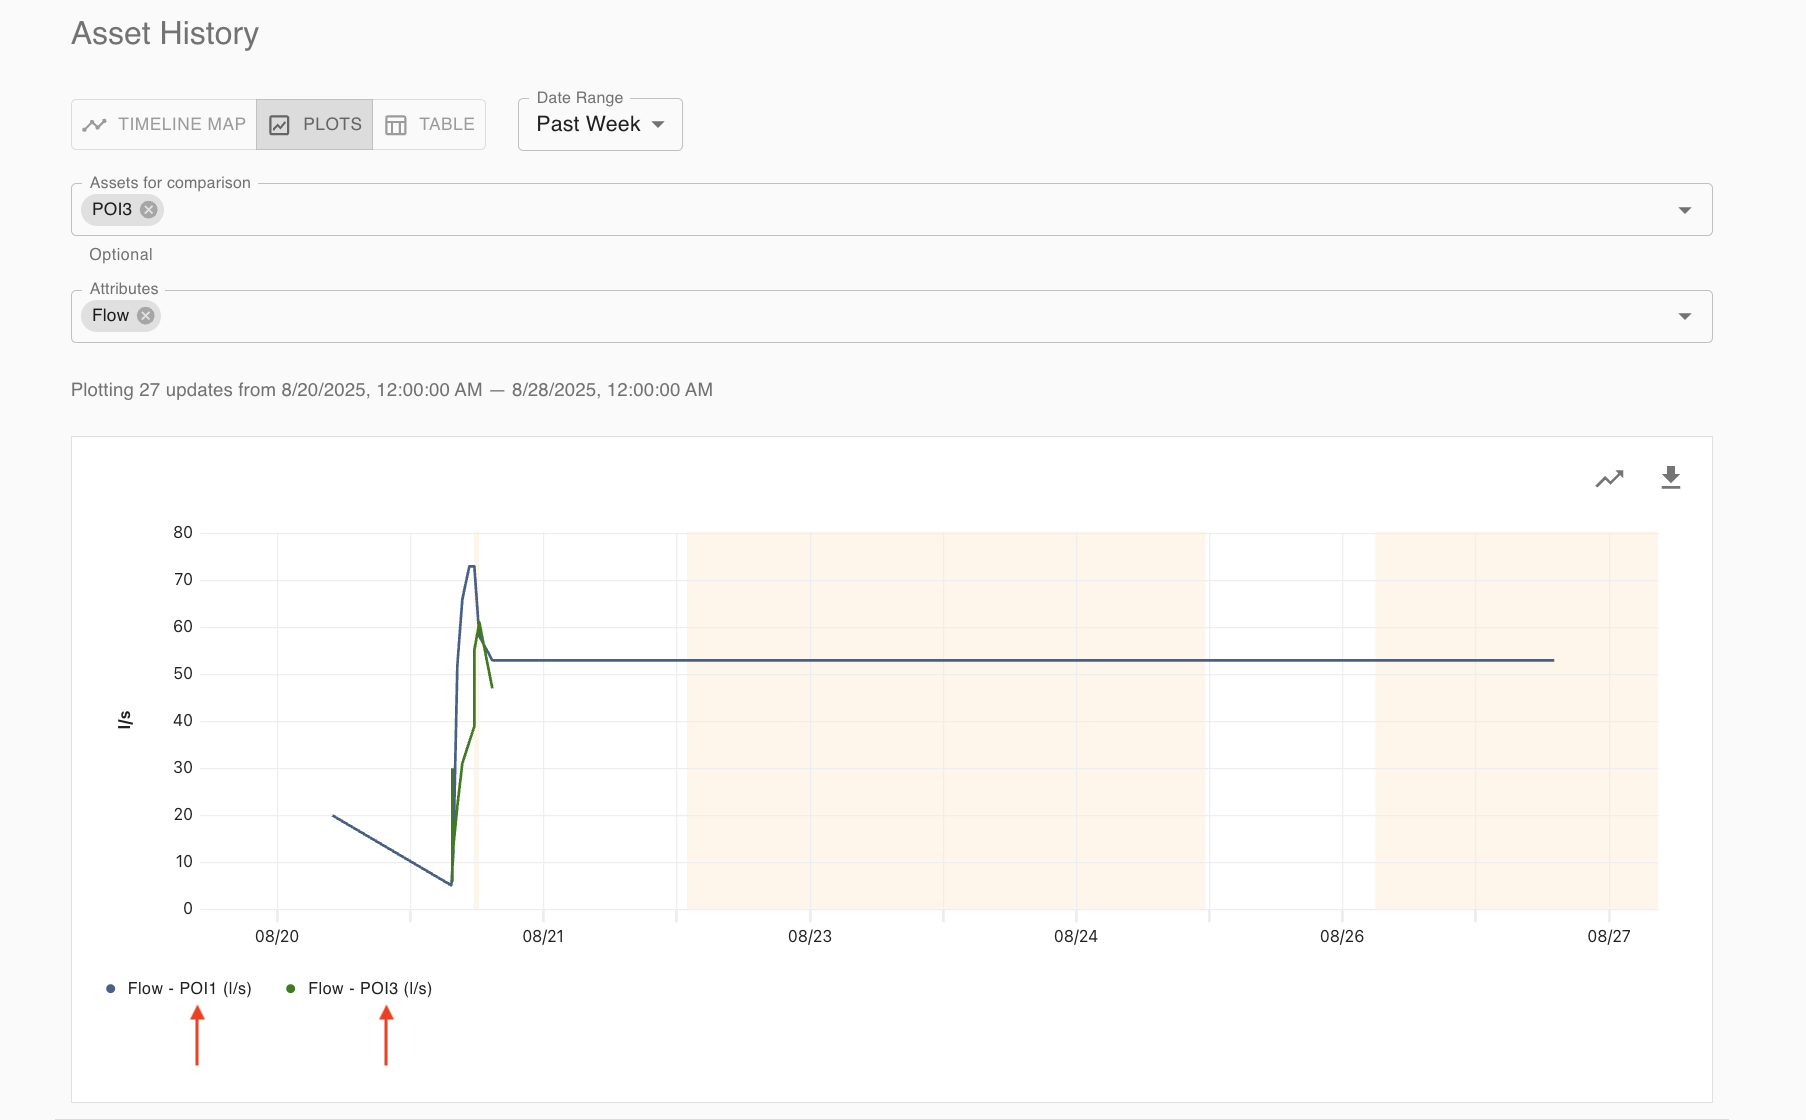
Note that if you are viewing an attribute for which both assets have data, the assets' names are added to the legend to help you easily identify where the data is coming from.
Data resolution
If your data needs to be reduced for performance reasons, you will receive a visual indicator with information about the amount of data reduction that occurred per attribute:
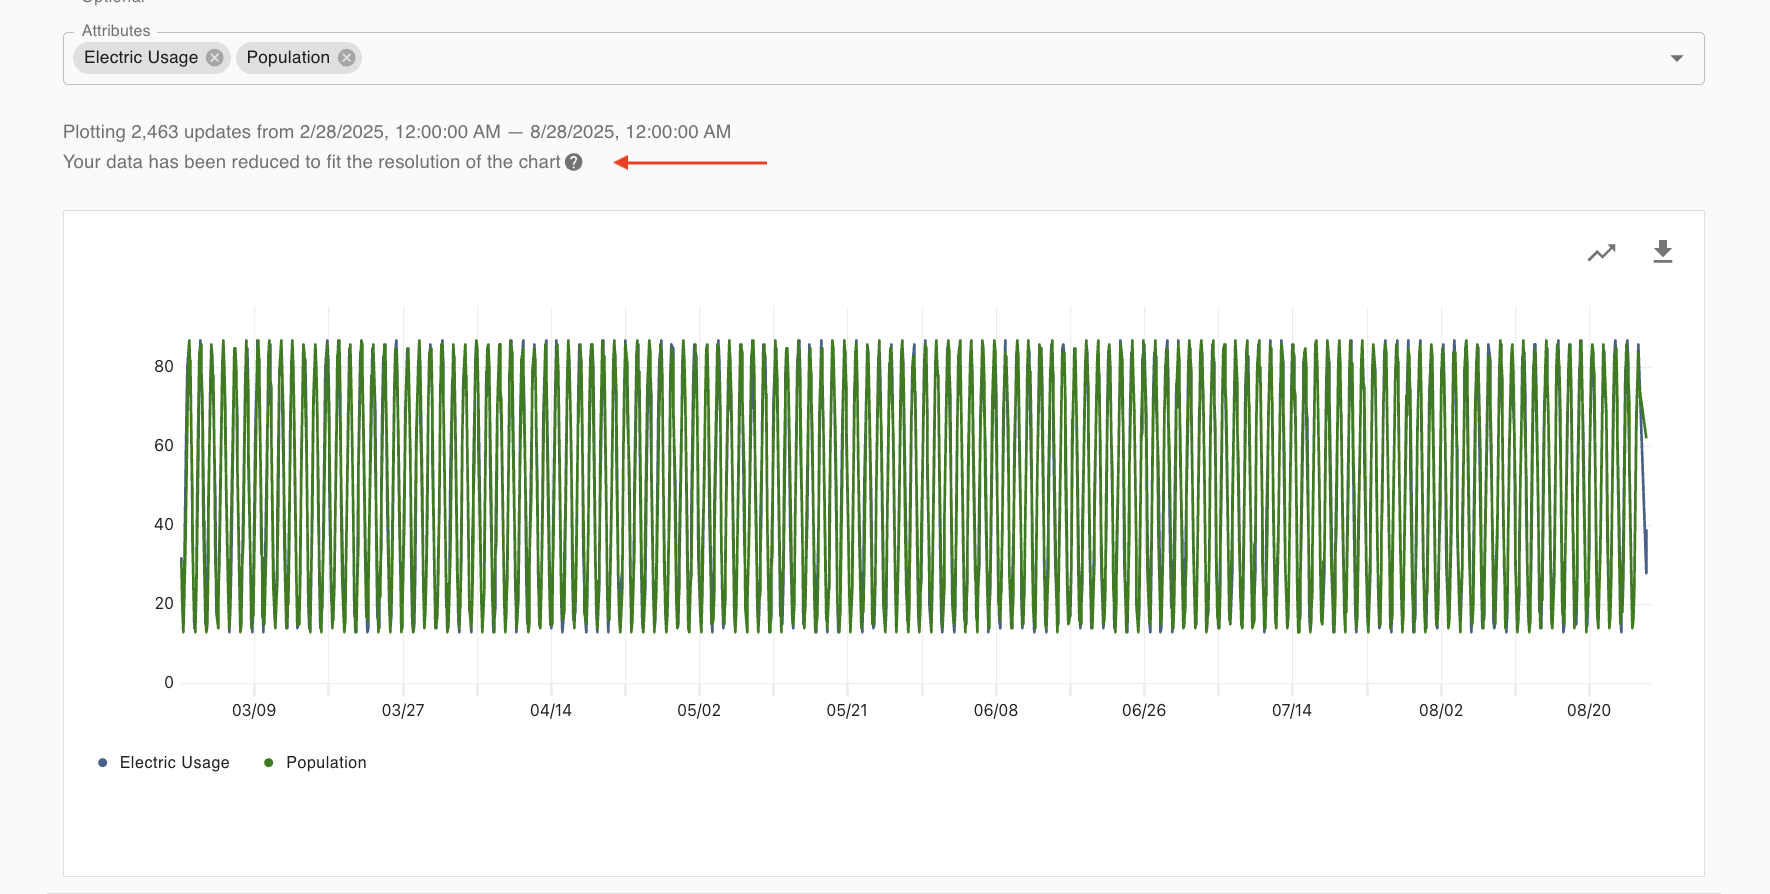
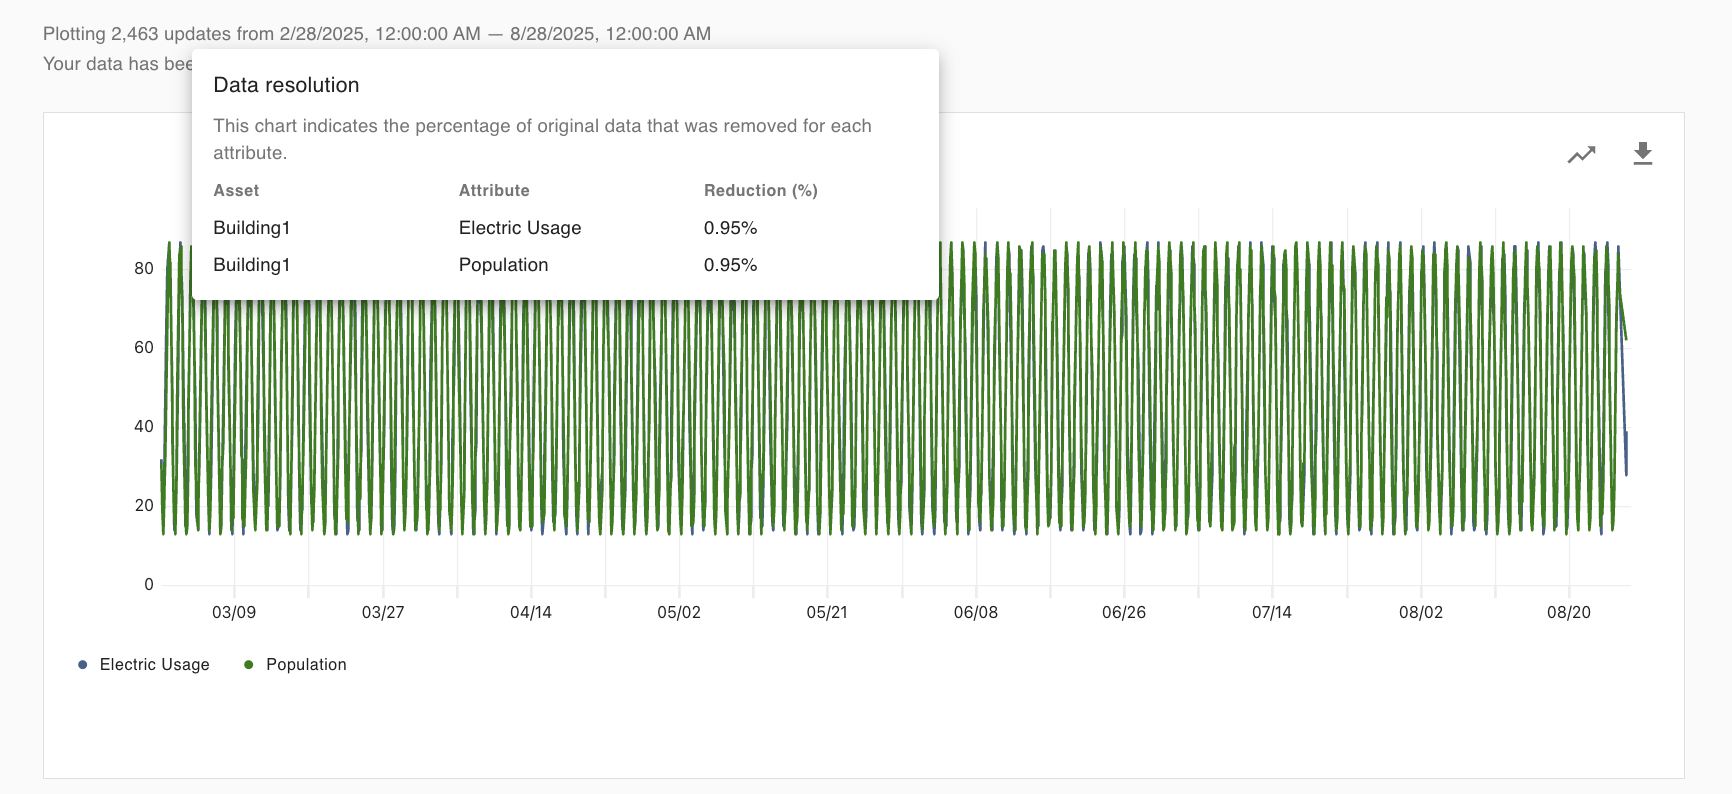
Data reduction occurs based on the density of data you are returning and the size of the chart on your screen.