Areas
Areas are similar to assets but include a geofence better defining their location in cartesian (XYZ) or polar (latitude/longitude) coordinates. Like assets, areas can be configured to have multiple types and rules that run against them. This is in addition to monitoring things like temperature and asset movements inside or outside of them.
Add area
1. Click Areas on the left menu:
2. Click the plus sign on the top right of the page to add a new area.
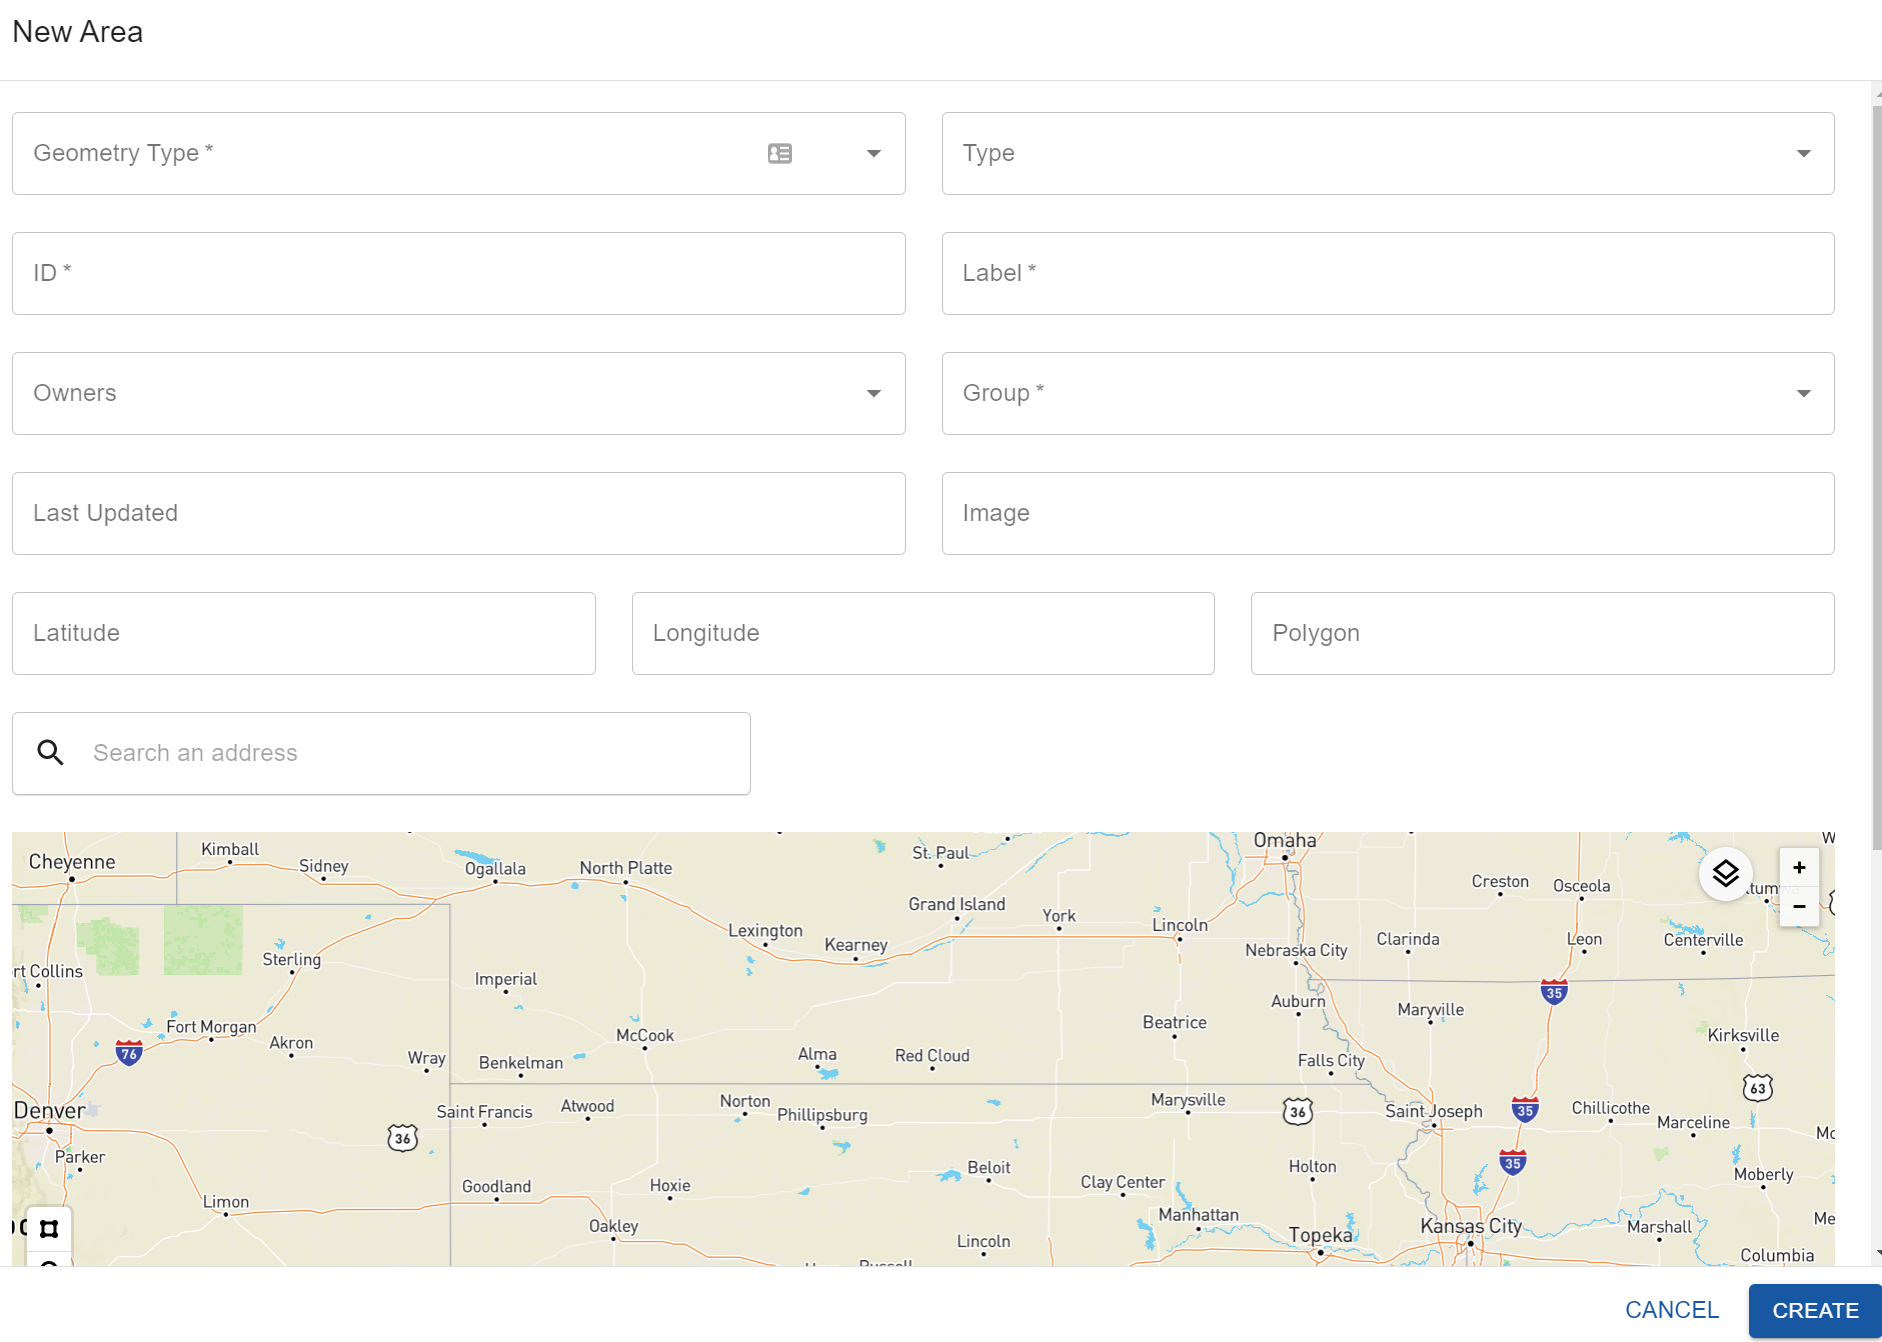
3. Fill out the information and click create:

Required values
Value | Definition |
Geometry Type | The location’s model view type (GPS, Indoor Model, and Indoor Area) |
ID | The area’s unique ID |
Label | The area’s name |
Group | Grouped by related users, assets, and area |
Optional values
Value | Definition |
Type | Assign an area type that was created previously |
Owners | The user(s) email managing the area |
Last updated | Timestamp of the area’s most recent update |
Image | An asset’s image to be kept on record |
Latitude | The latitude of the area’s map location. Click the map’s marker tool to define this. |
Longitude | The longitude of the area’s map location. Click the map’s marker tool to define this. |
Polygon | An array of cartesian coordinates. Click the map’s polygon tool to define these. |
Assets | The assets assigned to the area |
Description | The area’s description |
Here is a create area video tutorial.
View area
1. Click Areas on the left menu:
2. You can search or filter the areas you are looking for:
3. Here is an example of an area that displays:

4. You can zoom in and out by clicking the plus and minus buttons on the top right of the map.
5. Click an area to view its details.
6. Click the controls icon to view a selected area or the map in satellite mode:

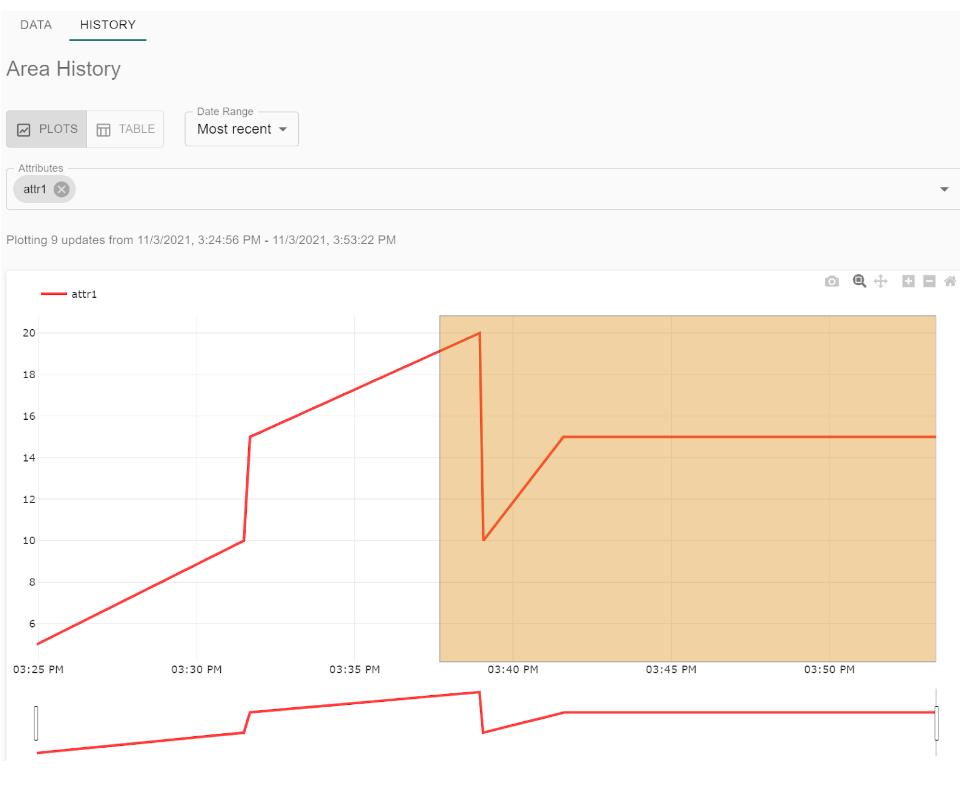
7. The area’s history can be seen by clicking the history tab. This is an example of what it looks like when Plots is selected:

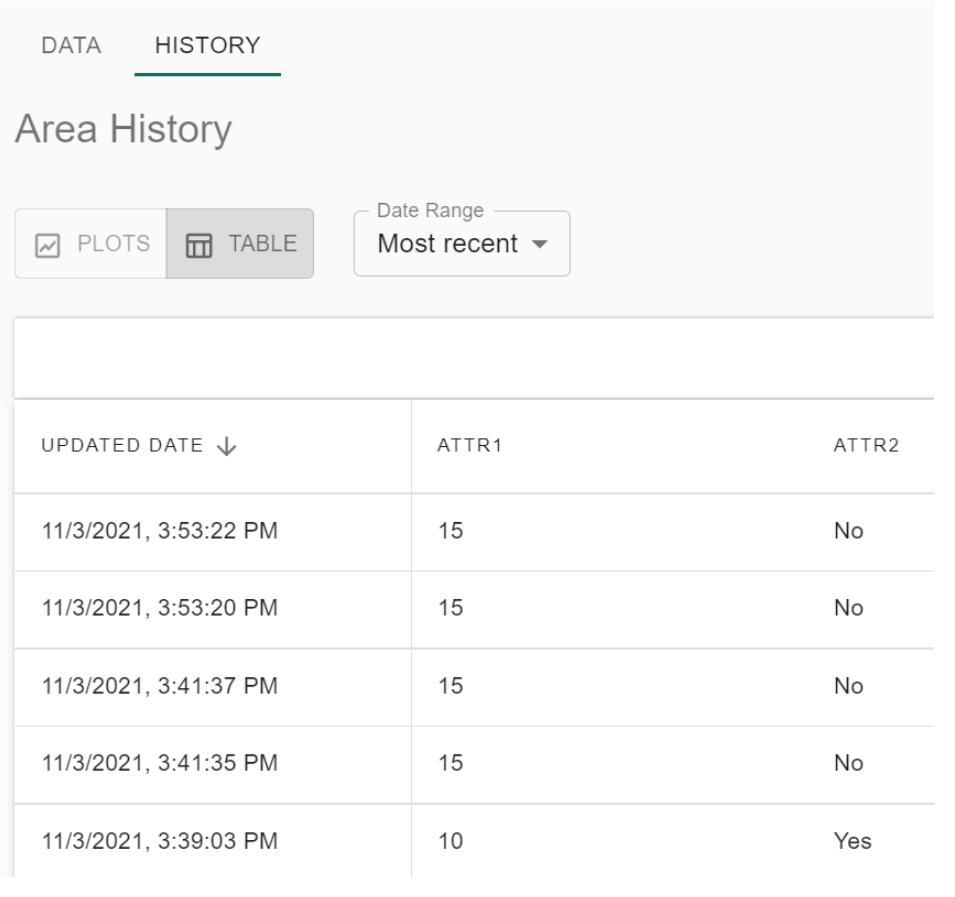
This is an example of what it looks like when Table is selected:

You can display the history by date range by selecting that field:

